
Has GE’s 2025 Surge Left Limited Upside for New Investors?
- If you are wondering whether General Electric is still attractive after its huge run, or if the easy money has already been made, this breakdown is for you.
- Despite a 1.7% pullback over the last week and a 9.1% slide over the past month, GE is still up 68.2% year to date, 69.2% over 1 year, and an eye catching 467.3% over 3 years.
- Those kinds of gains have been driven by a multiyear reshaping of the business, including completing its split into more focused companies and pushing harder into energy and aerospace. Together, these moves have helped investors view GE less as a turnaround story and more as a streamlined industrial and energy player with clearer growth levers.
- Yet, when we run GE through our 6 point valuation framework, it scores just 0/6 on our undervaluation checks. This raises a big question about how much future upside is already priced in. Next, we unpack the usual valuation approaches and, by the end, explore a different way to think about what GE may really be worth.
General Electric scores just 0/6 on our valuation checks. See what other red flags we found in the full valuation breakdown.
Approach 1: General Electric Discounted Cash Flow (DCF) Analysis
A Discounted Cash Flow model estimates what a company is worth by projecting its future cash flows and discounting them back to today in $ terms. For General Electric, the latest twelve month free cash flow is about $6.5 billion, and analysts see this rising meaningfully over the rest of the decade.
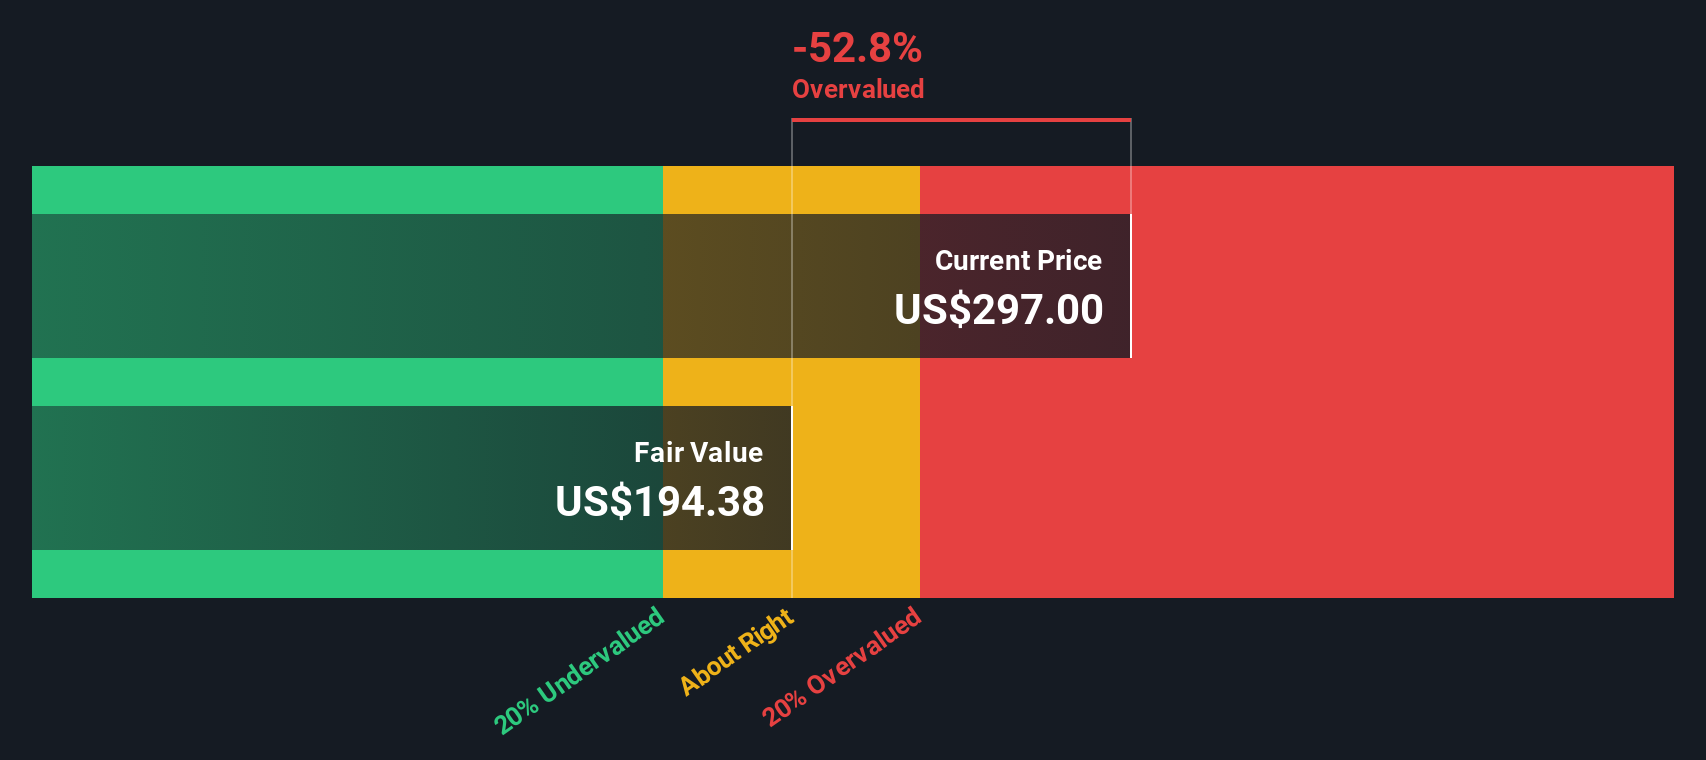
Based on a 2 Stage Free Cash Flow to Equity model, cash flow is forecast to grow to around $10.6 billion by 2029, with further growth extrapolated out to 2035 using more moderate assumptions. Each of these future cash flows is discounted back to present value, then summed, to arrive at an intrinsic value estimate of roughly $219.82 per share.
Compared with the current share price, this implies GE is about 29.0% overvalued on a DCF basis. This suggests that a lot of optimistic cash flow growth is already reflected in the valuation and leaves a thinner margin of safety for new investors.
Result: OVERVALUED
Our Discounted Cash Flow (DCF) analysis suggests General Electric may be overvalued by 29.0%. Discover 909 undervalued stocks or create your own screener to find better value opportunities.
Approach 2: General Electric Price vs Earnings
For profitable companies like General Electric, the price to earnings ratio is a straightforward way to gauge how much investors are willing to pay for each dollar of current earnings. The higher the expected growth and the lower the perceived risk, the more investors are usually prepared to pay, which pushes a normal or fair PE ratio higher. When growth slows or risks rise, that fair range typically comes down.
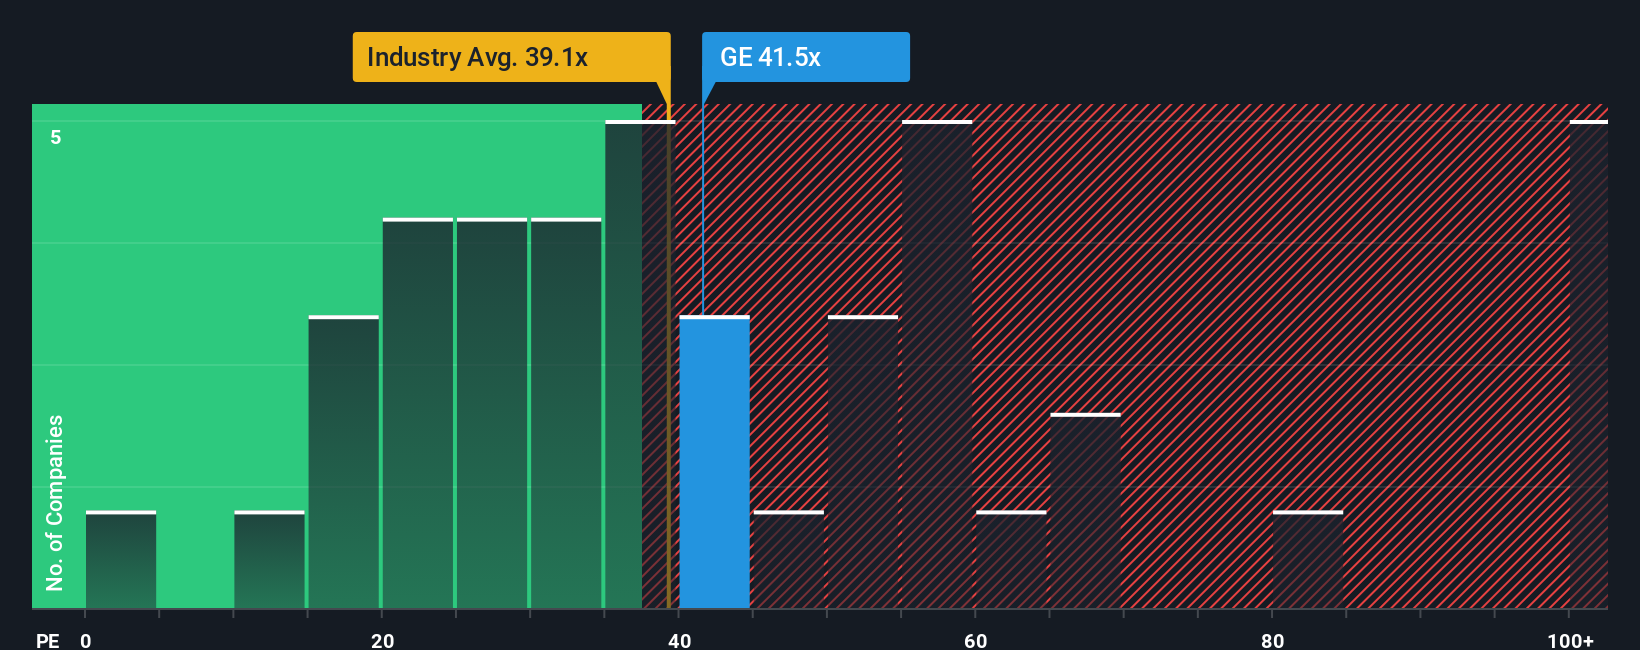
GE currently trades on a PE of about 37.1x, very close to the Aerospace and Defense industry average of roughly 36.7x and above the broader peer group average of 25.7x. On the surface, that suggests the market already assigns GE a premium versus many peers, but not versus its immediate industry.
Simply Wall St’s Fair Ratio for GE is 35.9x, which is its view of what a reasonable PE should be once you factor in the company’s earnings growth outlook, profit margins, industry positioning, market cap and specific risks. This is more tailored than a simple comparison to peers or the industry, which can miss important differences in quality and risk. With GE’s actual PE only slightly above this Fair Ratio, the stock looks marginally expensive rather than clearly cheap or stretched.
Result: OVERVALUED
PE ratios tell one story, but what if the real opportunity lies elsewhere? Discover 1446 companies where insiders are betting big on explosive growth.
Upgrade Your Decision Making: Choose your General Electric Narrative
Earlier we mentioned that there is an even better way to understand valuation, so let us introduce you to Narratives, a simple framework that lets you describe the story you believe about a company and connect it directly to your assumptions for future revenue, earnings, margins and ultimately fair value.
Instead of just accepting one DCF or PE number, a Narrative on Simply Wall St links three pieces together: the business story you believe, the financial forecast that flows from that story, and the fair value that those numbers imply. This helps you see clearly why a stock looks expensive or cheap to you personally.
On the Community page, investors can quickly create and adjust Narratives for GE, then compare the fair value they imply with the current share price to decide whether today looks like a buy, hold or sell. Those Narratives automatically refresh as new earnings, news and guidance are released so your view stays current without starting from scratch each time.
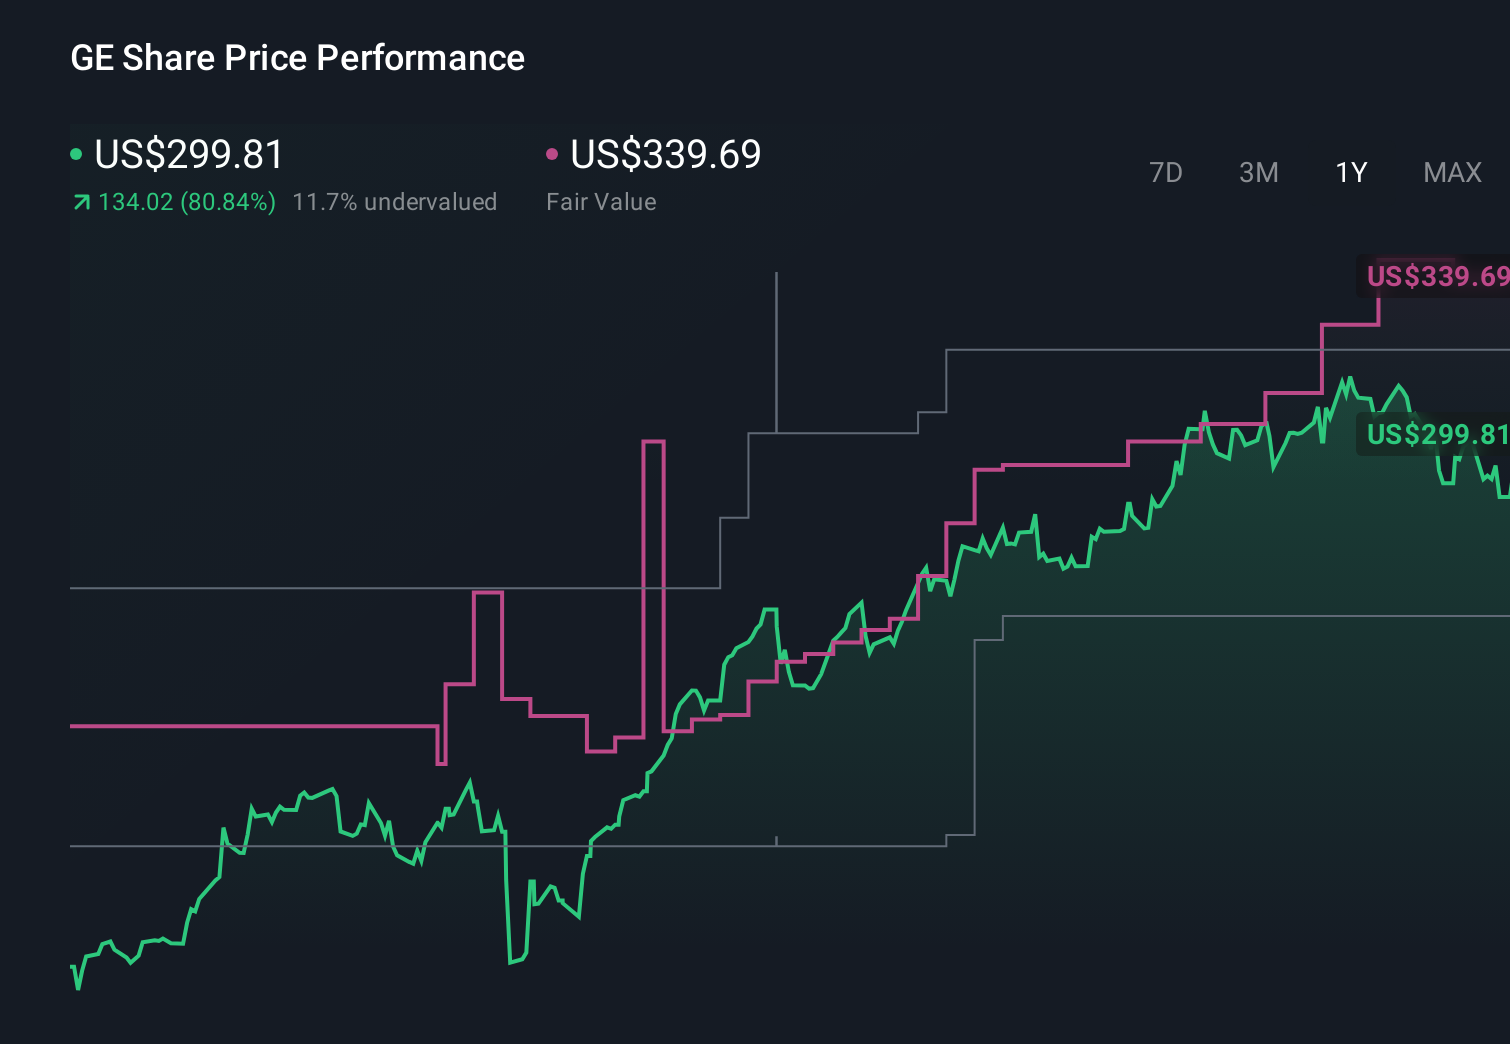
For example, one GE Narrative on the platform might assume faster aerospace growth, higher long term margins and a fair value near 340 dollars. A more cautious Narrative could bake in slower growth, more margin pressure and a fair value closer to 266 dollars, illustrating how different perspectives lead to very different conclusions about potential outcomes from today’s price.
Do you think there's more to the story for General Electric? Head over to our Community to see what others are saying!
This article by Simply Wall St is general in nature. We provide commentary based on historical data and analyst forecasts only using an unbiased methodology and our articles are not intended to be financial advice. It does not constitute a recommendation to buy or sell any stock, and does not take account of your objectives, or your financial situation. We aim to bring you long-term focused analysis driven by fundamental data. Note that our analysis may not factor in the latest price-sensitive company announcements or qualitative material. Simply Wall St has no position in any stocks mentioned.
Have feedback on this article? Concerned about the content? Get in touch with us directly. Alternatively, email editorial-team@simplywallst.com