
Manchester United (NYSE:MANU) Q1 Loss Deepens, Testing Turnaround Profitability Narrative
Manchester United (NYSE:MANU) opened Q1 2026 with revenue of about £140.3 million and a basic EPS of roughly -£0.04, alongside net income of around -£6.6 million, keeping the club in loss-making territory even as it reports another busy quarter of activity. The club has seen quarterly revenue move between roughly £143.1 million and £198.7 million over the past year while EPS has swung from £0.01 to as low as about -£0.16, which sets up a narrative where a growing top line and negative EPS keep margins under pressure but give investors a clear view of where profitability needs to improve next.
See our full analysis for Manchester United.With the latest numbers on the table, the next step is to see how this revenue growth and persistent red ink stack up against the big stories investors tell about Manchester United, and where those narratives might need to be updated.
Curious how numbers become stories that shape markets? Explore Community Narratives
Losses Narrow On Trailing Basis
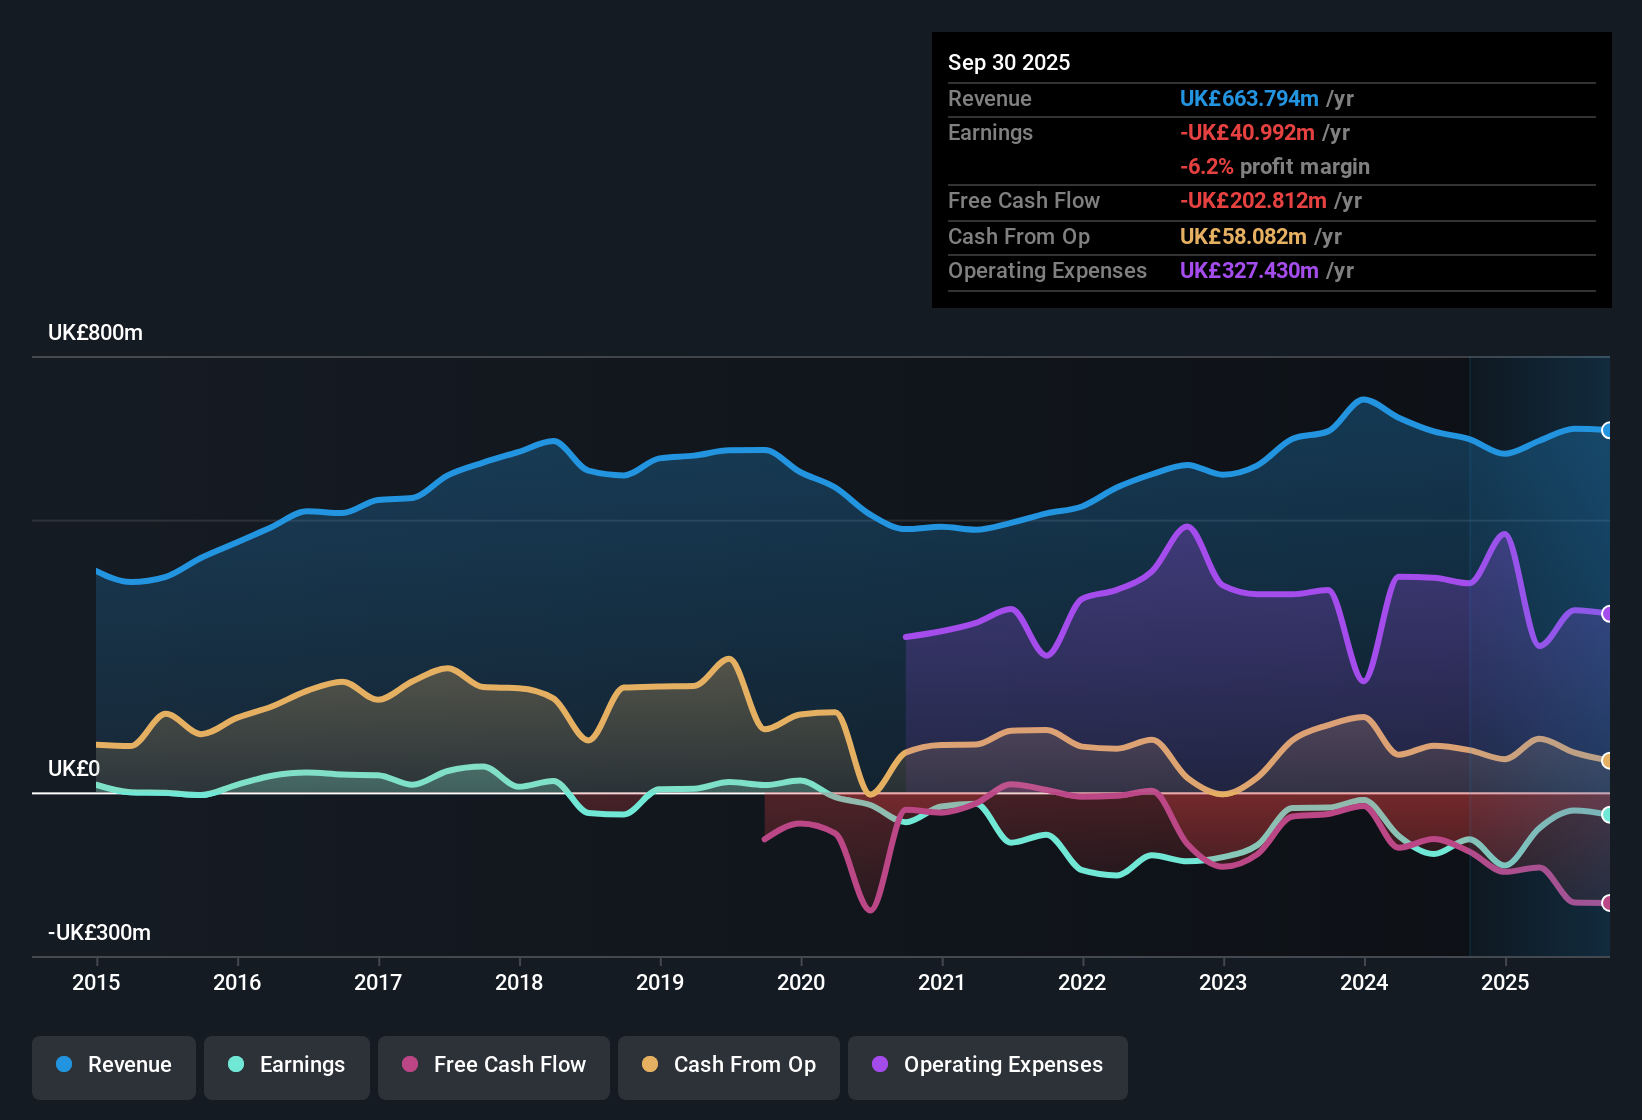
- Over the last twelve months, net income excluding extra items was about -£41.0 million on £663.8 million of revenue, compared with -£113.2 million on £661.8 million two years ago, showing losses have been smaller even as sales stayed in the same £620 million to £667 million range.
- What stands out for the bullish view is that this five year trend of losses shrinking at roughly 2.7% per year sits next to a still negative Q1 2026 net income of -£6.6 million,
- Supporters of the bullish case can point to revenue holding above £620 million on a trailing basis while losses have come down from around -£134.2 million to -£41.0 million, which matches the idea of gradual financial repair.
- At the same time, skeptics can note that quarterly net income has dipped in and out of the red, from a small profit of £1.3 million in early 2025 to a loss again in Q1 2026, so the path to consistent profitability has not yet shown up in the reported numbers.
92% Earnings Growth Forecasts
- Forecasts call for earnings to grow about 92.4% per year with Manchester United expected to become profitable within three years, even though trailing twelve month basic EPS is still around -£0.24 per share.
- Consistent with a bullish narrative, this projected earnings catch up is being weighed against the current loss making status,
- On one side, bulls may argue that moving from trailing net income of about -£41.0 million toward break even would be a major swing if the 92.4% growth pace is realised across multiple years.
- On the other side, the fact that recent quarterly EPS has stayed negative in four of the last five reported quarters, ranging roughly between -£0.02 and -£0.16, challenges the idea that the turnaround is already visible in the near term figures.
DCF Upside With Short Runway
- On valuation, the stock trades around $15.78 per share versus a DCF fair value of roughly $19.51, about 19% higher, while price to sales of 3.1 times is in line with peers but above the broader US Entertainment average of 1.4 times.
- From a more cautious angle, critics highlight that this apparent DCF upside is paired with less than one year of cash runway and still negative earnings,
- The gap between the share price and DCF fair value backs the idea of potential upside but the elevated price to sales versus the wider industry suggests the market already accepts a premium for the brand.
- Because the business remains unprofitable on about £663.8 million of trailing revenue, the combination of a relatively rich sales multiple and a short cash runway keeps the bearish focus firmly on execution and funding risk rather than just upside to intrinsic value.
Next Steps
Don't just look at this quarter; the real story is in the long-term trend. We've done an in-depth analysis on Manchester United's growth and its valuation to see if today's price is a bargain. Add the company to your watchlist or portfolio now so you don't miss the next big move.
Explore Alternatives
Despite revenue holding up and forecasts pointing to future growth, Manchester United still battles recurring losses, a short cash runway and execution risk around reaching sustainable profitability.
If that mix feels too fragile, use our solid balance sheet and fundamentals stocks screener (1944 results) to quickly focus on businesses with stronger finances. This can give you sturdier options while this turnaround story plays out.
This article by Simply Wall St is general in nature. We provide commentary based on historical data and analyst forecasts only using an unbiased methodology and our articles are not intended to be financial advice. It does not constitute a recommendation to buy or sell any stock, and does not take account of your objectives, or your financial situation. We aim to bring you long-term focused analysis driven by fundamental data. Note that our analysis may not factor in the latest price-sensitive company announcements or qualitative material. Simply Wall St has no position in any stocks mentioned.
Have feedback on this article? Concerned about the content? Get in touch with us directly. Alternatively, email editorial-team@simplywallst.com