
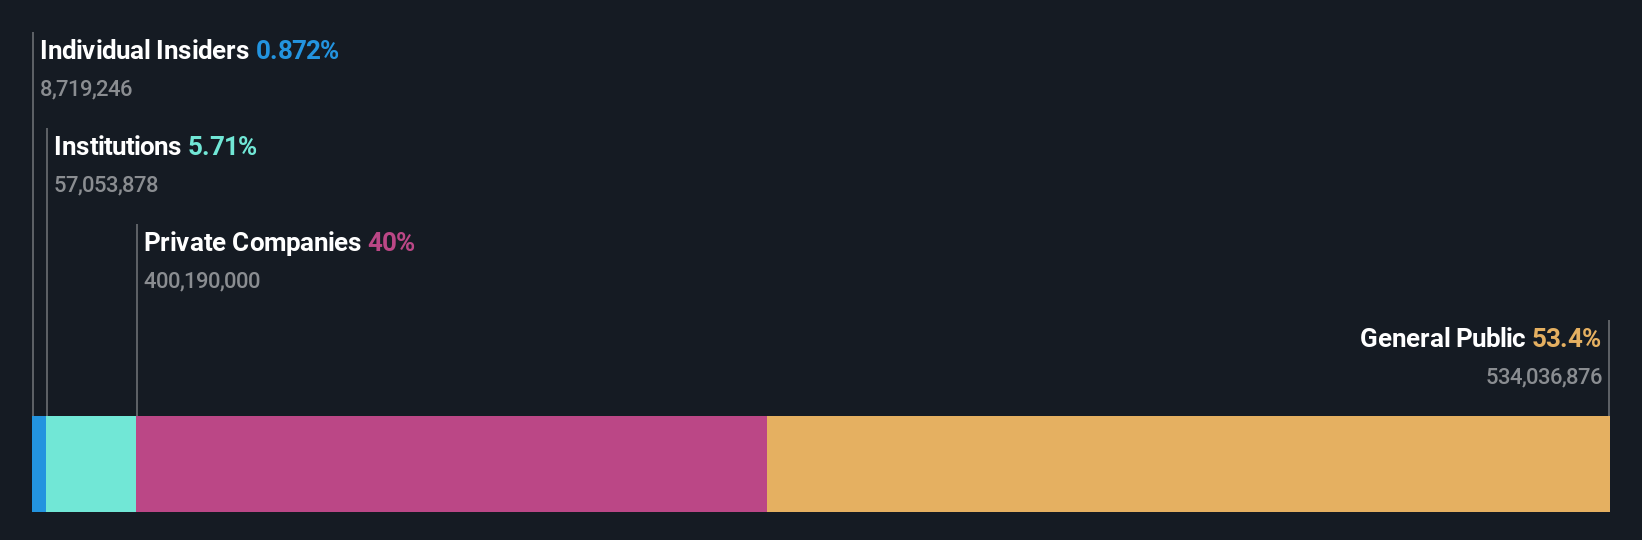
Almarai Company's (TADAWUL:2280) top owners are retail investors with 53% stake, while 40% is held by private companies
Key Insights
- Significant control over Almarai by retail investors implies that the general public has more power to influence management and governance-related decisions
- The top 25 shareholders own 46% of the company
- Using data from analyst forecasts alongside ownership research, one can better assess the future performance of a company
If you want to know who really controls Almarai Company (TADAWUL:2280), then you'll have to look at the makeup of its share registry. With 53% stake, retail investors possess the maximum shares in the company. Put another way, the group faces the maximum upside potential (or downside risk).
And private companies on the other hand have a 40% ownership in the company.
In the chart below, we zoom in on the different ownership groups of Almarai.
View our latest analysis for Almarai
What Does The Institutional Ownership Tell Us About Almarai?
Many institutions measure their performance against an index that approximates the local market. So they usually pay more attention to companies that are included in major indices.
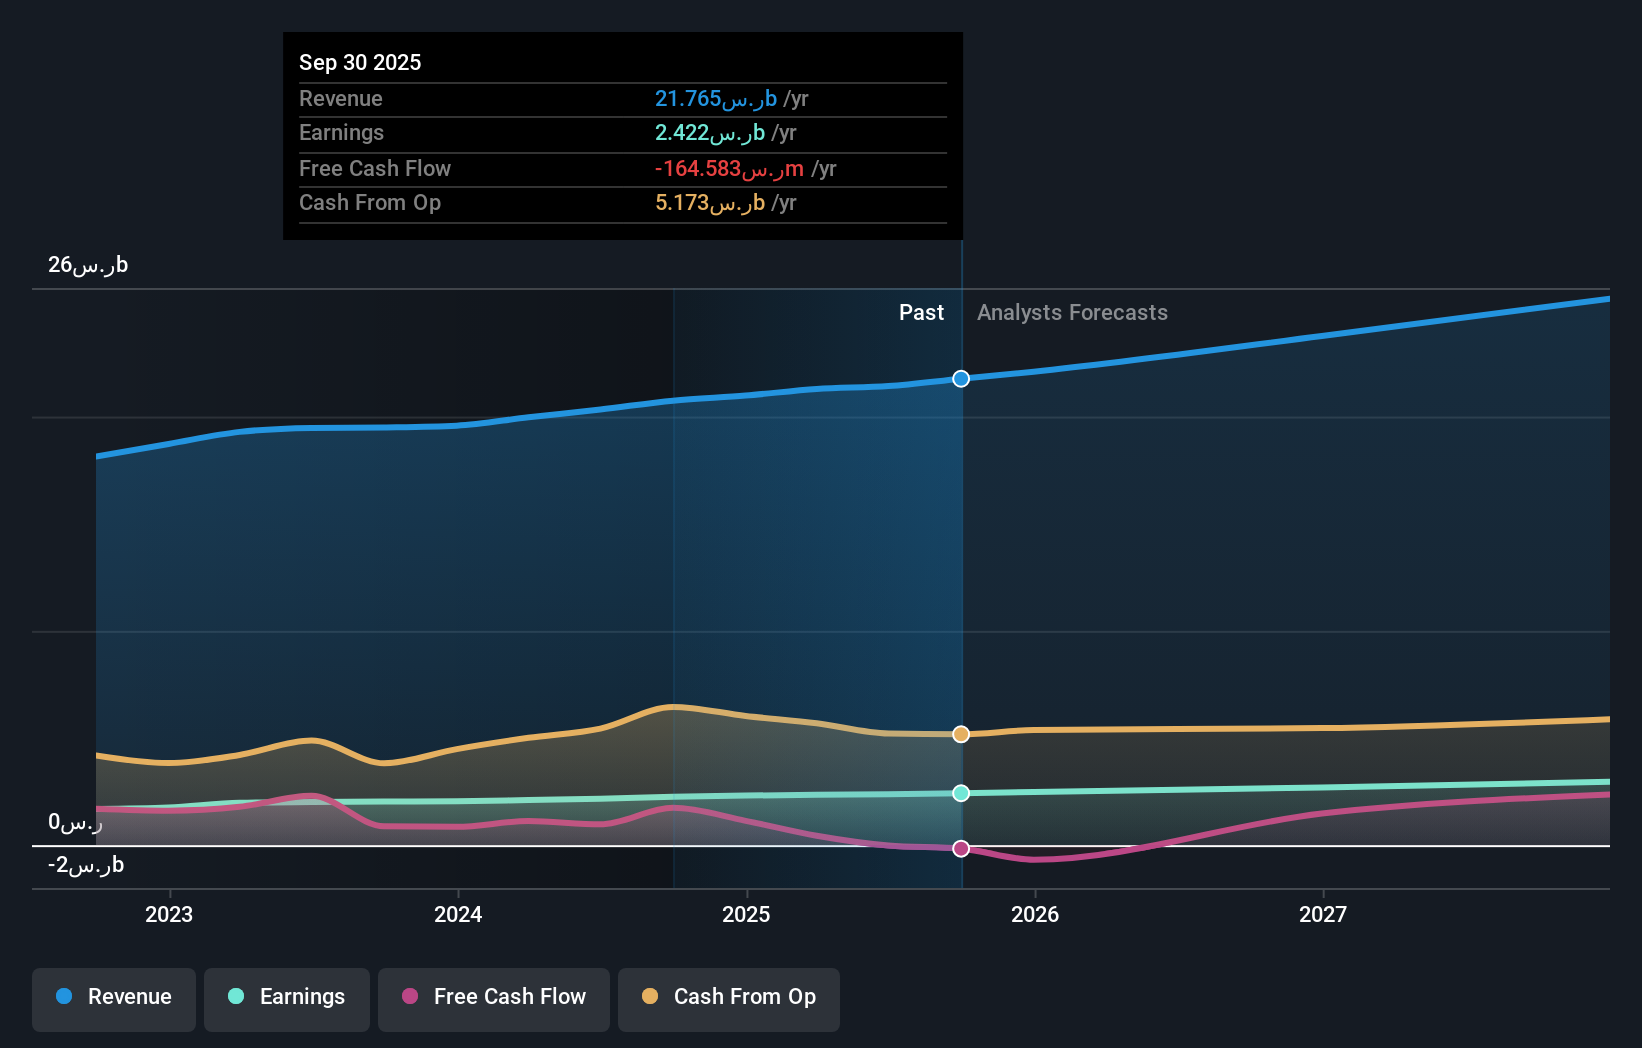
We can see that Almarai does have institutional investors; and they hold a good portion of the company's stock. This can indicate that the company has a certain degree of credibility in the investment community. However, it is best to be wary of relying on the supposed validation that comes with institutional investors. They too, get it wrong sometimes. When multiple institutions own a stock, there's always a risk that they are in a 'crowded trade'. When such a trade goes wrong, multiple parties may compete to sell stock fast. This risk is higher in a company without a history of growth. You can see Almarai's historic earnings and revenue below, but keep in mind there's always more to the story.
Almarai is not owned by hedge funds. Looking at our data, we can see that the largest shareholder is Sultan Holding Company with 24% of shares outstanding. For context, the second largest shareholder holds about 16% of the shares outstanding, followed by an ownership of 2.1% by the third-largest shareholder.
A deeper look at our ownership data shows that the top 25 shareholders collectively hold less than half of the register, suggesting a large group of small holders where no single shareholder has a majority.
While it makes sense to study institutional ownership data for a company, it also makes sense to study analyst sentiments to know which way the wind is blowing. Quite a few analysts cover the stock, so you could look into forecast growth quite easily.
Insider Ownership Of Almarai
The definition of company insiders can be subjective and does vary between jurisdictions. Our data reflects individual insiders, capturing board members at the very least. Company management run the business, but the CEO will answer to the board, even if he or she is a member of it.
Most consider insider ownership a positive because it can indicate the board is well aligned with other shareholders. However, on some occasions too much power is concentrated within this group.
Our most recent data indicates that insiders own less than 1% of Almarai Company. However, it's possible that insiders might have an indirect interest through a more complex structure. Being so large, we would not expect insiders to own a large proportion of the stock. Collectively, they own ر.س382m of stock. It is good to see board members owning shares, but it might be worth checking if those insiders have been buying.
General Public Ownership
The general public -- including retail investors -- own 53% of Almarai. This level of ownership gives investors from the wider public some power to sway key policy decisions such as board composition, executive compensation, and the dividend payout ratio.
Private Company Ownership
Our data indicates that Private Companies hold 40%, of the company's shares. Private companies may be related parties. Sometimes insiders have an interest in a public company through a holding in a private company, rather than in their own capacity as an individual. While it's hard to draw any broad stroke conclusions, it is worth noting as an area for further research.
Next Steps:
While it is well worth considering the different groups that own a company, there are other factors that are even more important. Consider risks, for instance. Every company has them, and we've spotted 2 warning signs for Almarai you should know about.
If you are like me, you may want to think about whether this company will grow or shrink. Luckily, you can check this free report showing analyst forecasts for its future.
NB: Figures in this article are calculated using data from the last twelve months, which refer to the 12-month period ending on the last date of the month the financial statement is dated. This may not be consistent with full year annual report figures.
Have feedback on this article? Concerned about the content? Get in touch with us directly. Alternatively, email editorial-team (at) simplywallst.com.
This article by Simply Wall St is general in nature. We provide commentary based on historical data and analyst forecasts only using an unbiased methodology and our articles are not intended to be financial advice. It does not constitute a recommendation to buy or sell any stock, and does not take account of your objectives, or your financial situation. We aim to bring you long-term focused analysis driven by fundamental data. Note that our analysis may not factor in the latest price-sensitive company announcements or qualitative material. Simply Wall St has no position in any stocks mentioned.