
Is Campbell Soup Now a Bargain After Its 32% Share Price Slide?
- Wondering if Campbell's dip has finally turned this pantry staple into a genuine value opportunity, or if it is a value trap in disguise?
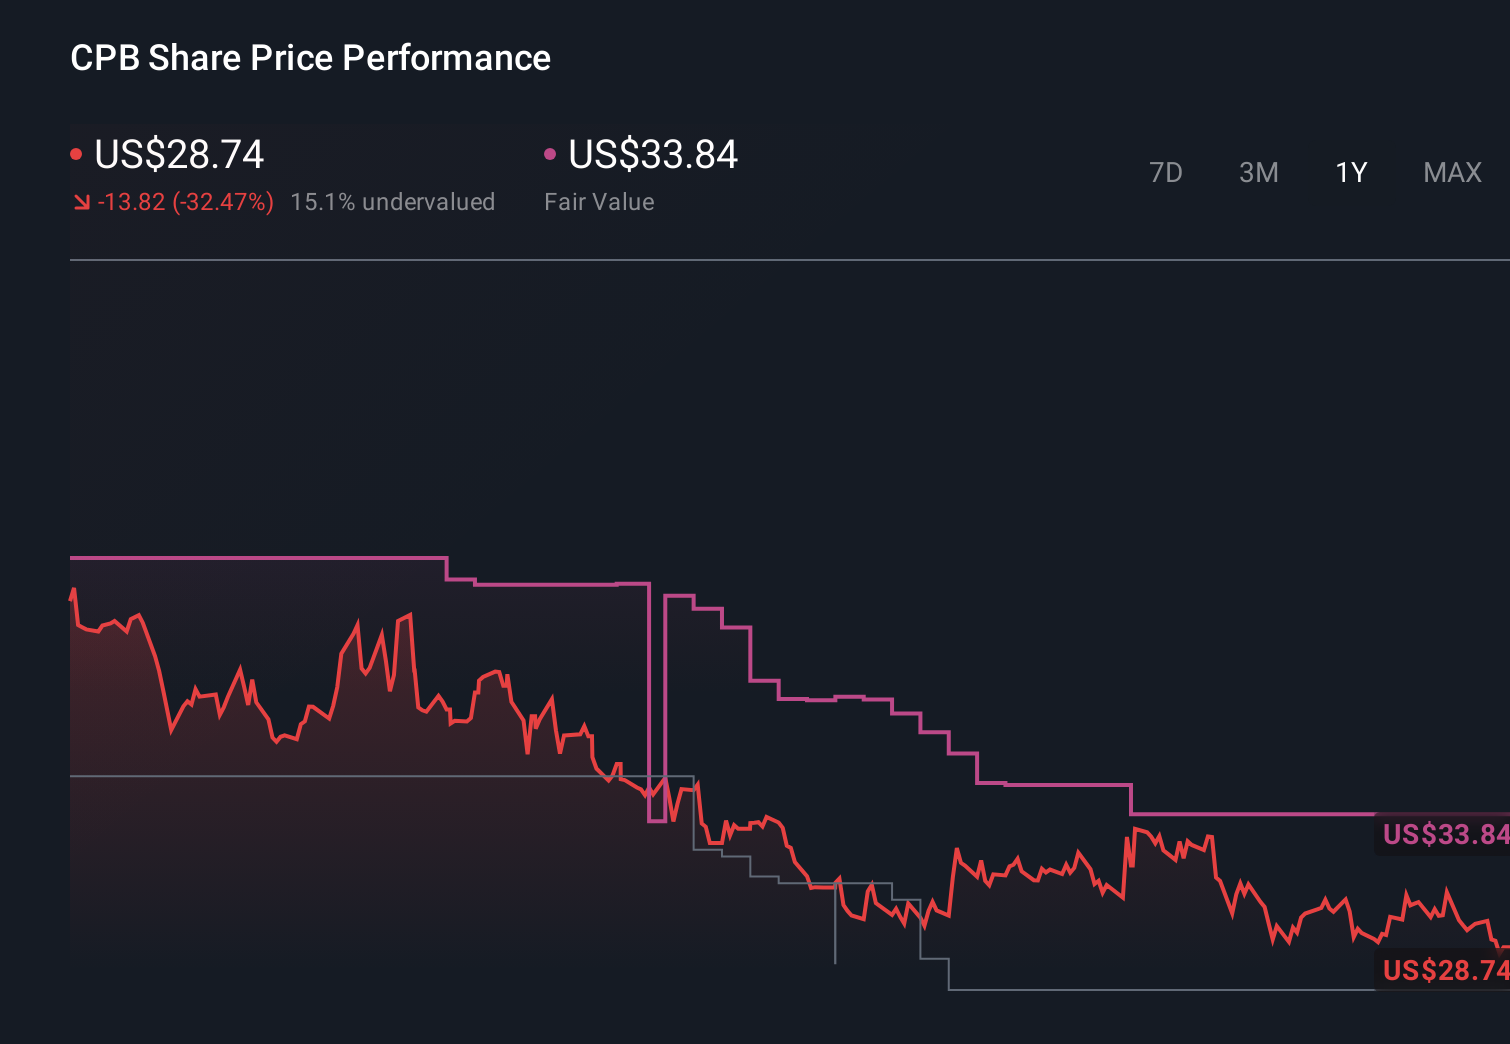
- The stock has slid about 3.2% over the last week and roughly 9.9% over the past month, capping off a much steeper slide of around 32.4% year to date and 30.8% over the last year.
- Recent headlines have focused on shifting consumer spending habits, with shoppers trading between brand names and private labels, as well as ongoing debates about how inflation and higher rates are reshaping the packaged foods aisle. At the same time, analysts have been reassessing traditional defensive names like Campbell's as investors rotate between safety and growth. This has helped explain some of the volatility in the share price.
- Right now, Campbell's scores a 4/6 valuation check, suggesting it screens as undervalued on most of our tests, but not all. Next, we will unpack what that score really means by walking through different valuation approaches before circling back to a more complete, and arguably better, way to think about what this stock is worth.
Find out why Campbell's's -30.8% return over the last year is lagging behind its peers.
Approach 1: Campbell's Discounted Cash Flow (DCF) Analysis
A Discounted Cash Flow, or DCF, model estimates what a company is worth by projecting its future cash flows and then discounting those back to today’s value. For Campbell's, the model uses a 2 Stage Free Cash Flow to Equity approach built on cash flow projections.
Campbell's last twelve months Free Cash Flow stands at about $658.3 Million, with analyst and extrapolated estimates pointing to Free Cash Flow rising to roughly $900.8 Million by 2035. In the nearer term, forecasts see Free Cash Flow around $860.5 Million in 2026 and $765.5 Million by 2028, with Simply Wall St extrapolating the later years once formal analyst coverage thins out.
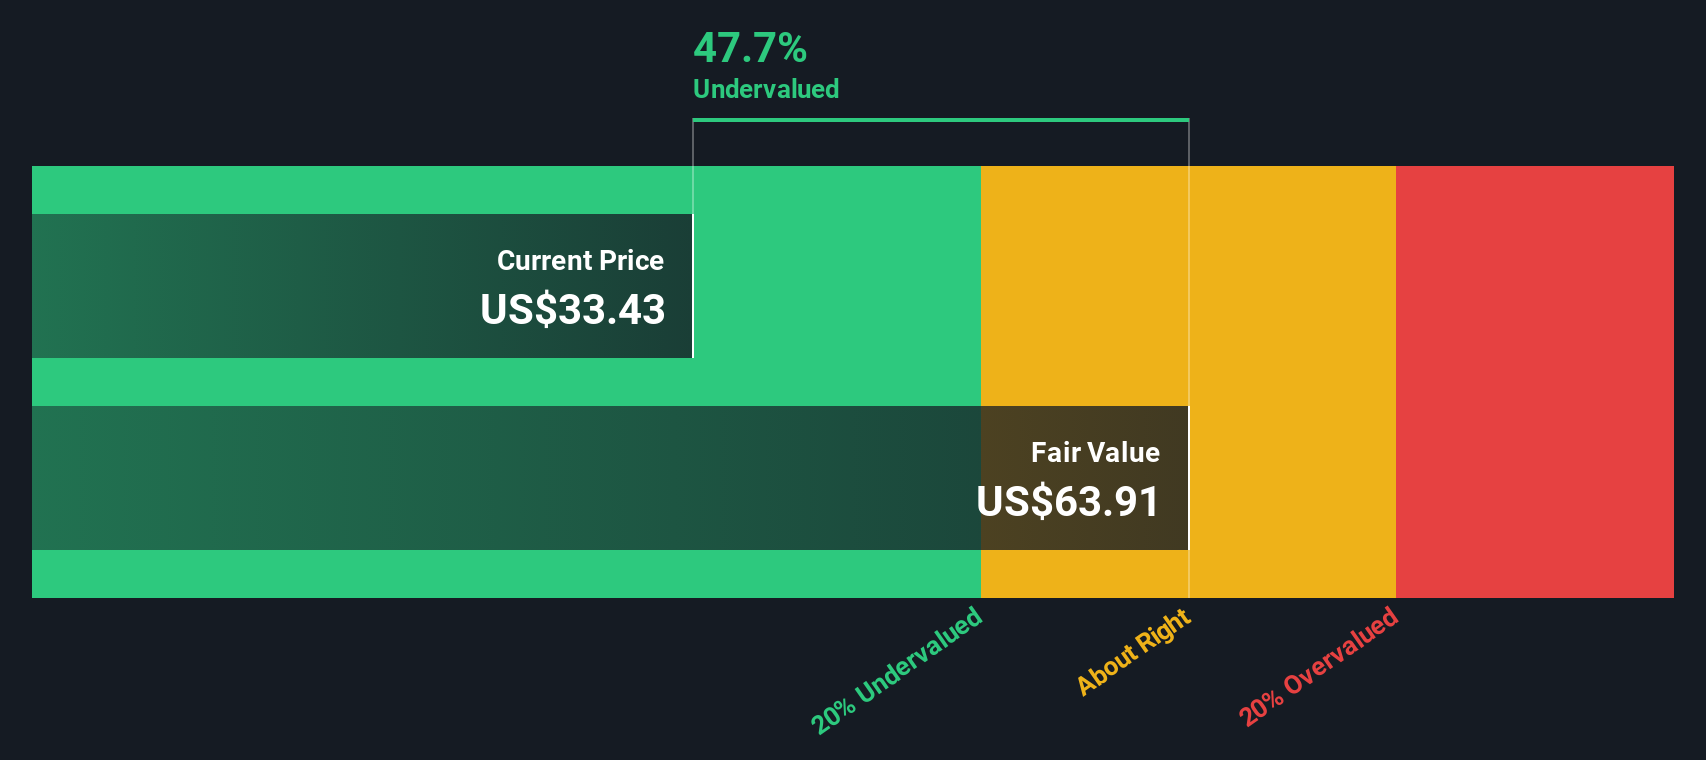
When all of these projected cash flows are discounted back using the DCF model, the estimated intrinsic value comes out at about $61.33 per share. With the DCF suggesting the stock trades at roughly a 53.6% discount to this value, Campbell's currently screens as materially undervalued on a cash flow basis.
Result: UNDERVALUED
Our Discounted Cash Flow (DCF) analysis suggests Campbell's is undervalued by 53.6%. Track this in your watchlist or portfolio, or discover 905 more undervalued stocks based on cash flows.
Approach 2: Campbell's Price vs Earnings
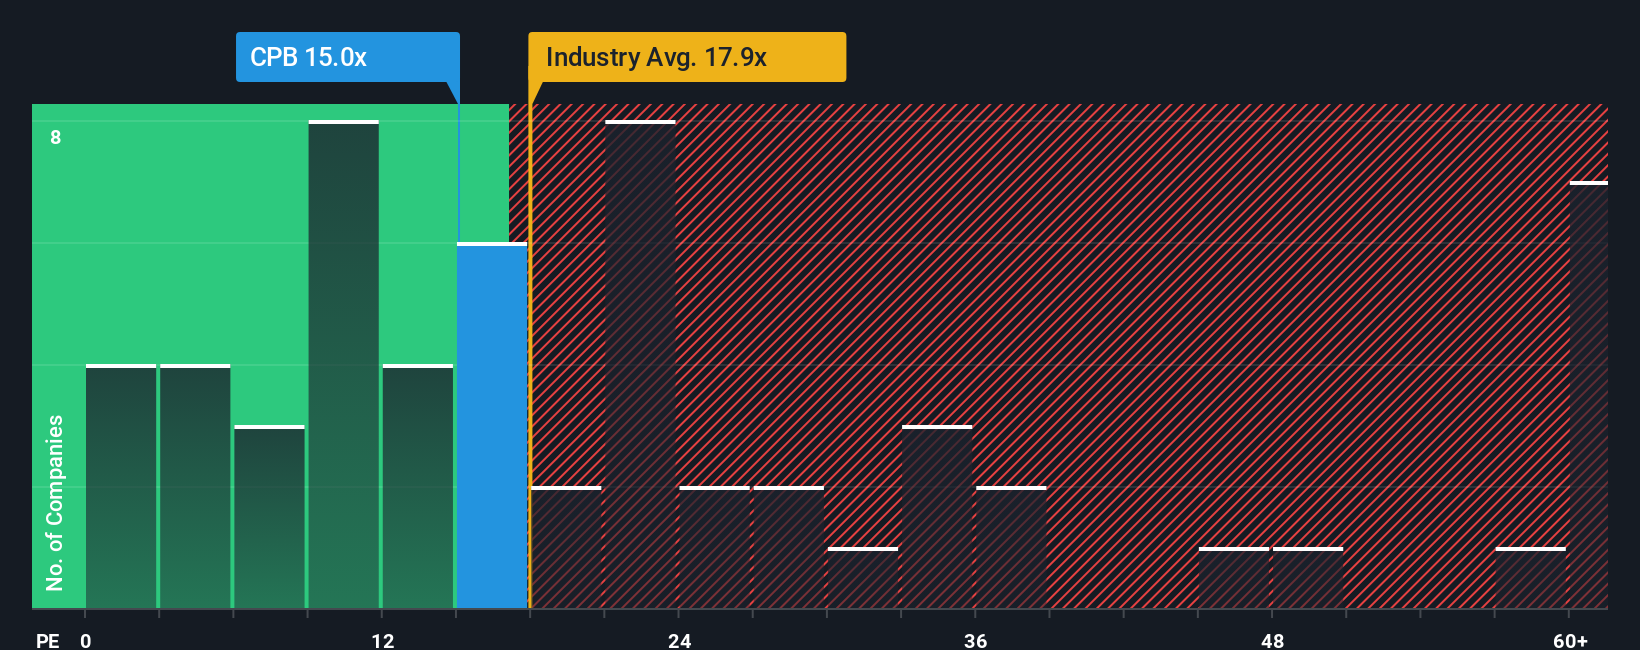
For a consistently profitable company like Campbell's, the Price to Earnings, or PE, ratio is a practical way to compare what investors are paying for each dollar of current earnings. In general, companies with stronger growth prospects and lower perceived risk can justify a higher PE, while slower growing or riskier businesses tend to trade on lower multiples.
Campbell's currently trades on a PE of about 14.7x, which is slightly above its direct peer average of 13.9x, but well below the broader Food industry average of roughly 21.3x. Simply Wall St also calculates a proprietary Fair Ratio for Campbell's of about 19.4x. This reflects what its PE might be, given its earnings growth outlook, margins, industry classification, market value and risk profile.
This Fair Ratio is more tailored than a simple peer or industry comparison because it blends company specific fundamentals with sector and size effects, rather than assuming all food stocks deserve the same multiple. Comparing Campbell's actual PE of 14.7x with its Fair Ratio of 19.4x suggests the market is pricing the stock at a discount relative to what its fundamentals would typically warrant.
Result: UNDERVALUED
PE ratios tell one story, but what if the real opportunity lies elsewhere? Discover 1445 companies where insiders are betting big on explosive growth.
Upgrade Your Decision Making: Choose your Campbell's Narrative
Earlier we mentioned that there is an even better way to understand valuation, so let us introduce you to Narratives, a simple way to attach your own story about Campbell's future to the numbers behind its fair value. A Narrative is your view on where revenue, earnings and margins are heading, turned into a clear forecast that links the company’s story to an estimated fair value, and then compares that to today’s share price to help you decide whether to buy, hold or sell. Narratives on Simply Wall St, available in the Community page used by millions of investors, are easy to explore and adjust, and they update dynamically as new news or earnings are released so your thesis does not go stale. For Campbell's, one investor might build a bullish Narrative around premium snacks, resilient at home cooking demand and margin expansion, arriving at a fair value closer to the most optimistic target of $62. Another might focus on processed food headwinds, cost pressures and sluggish growth, seeing something nearer the $29 bear case instead.
Do you think there's more to the story for Campbell's? Head over to our Community to see what others are saying!
This article by Simply Wall St is general in nature. We provide commentary based on historical data and analyst forecasts only using an unbiased methodology and our articles are not intended to be financial advice. It does not constitute a recommendation to buy or sell any stock, and does not take account of your objectives, or your financial situation. We aim to bring you long-term focused analysis driven by fundamental data. Note that our analysis may not factor in the latest price-sensitive company announcements or qualitative material. Simply Wall St has no position in any stocks mentioned.
Have feedback on this article? Concerned about the content? Get in touch with us directly. Alternatively, email editorial-team@simplywallst.com