
Kewaunee Scientific (KEQU) Margin Deterioration Tests Bullish Undervaluation Narrative After Q2 2026 Results
Kewaunee Scientific (KEQU) has just turned in a mixed Q2 2026 scorecard, posting revenue of about $70.1 million and EPS of $0.85 as profitability continues to reflect a narrower net margin profile than a year ago. The company has seen quarterly revenue move from $47.8 million in Q2 2025 to $70.1 million in Q2 2026, while quarterly EPS has swung between $0.47 and $1.70 over the same stretch, underscoring how choppy earnings have become as margins compressed from last year’s levels.
See our full analysis for Kewaunee Scientific.With the latest numbers on the table, the next step is to weigh them against the most common stories investors tell about Kewaunee Scientific, highlighting where the data backs those narratives and where it pushes back.
Curious how numbers become stories that shape markets? Explore Community Narratives
Margins Slip as Net Profit Halves Year on Year
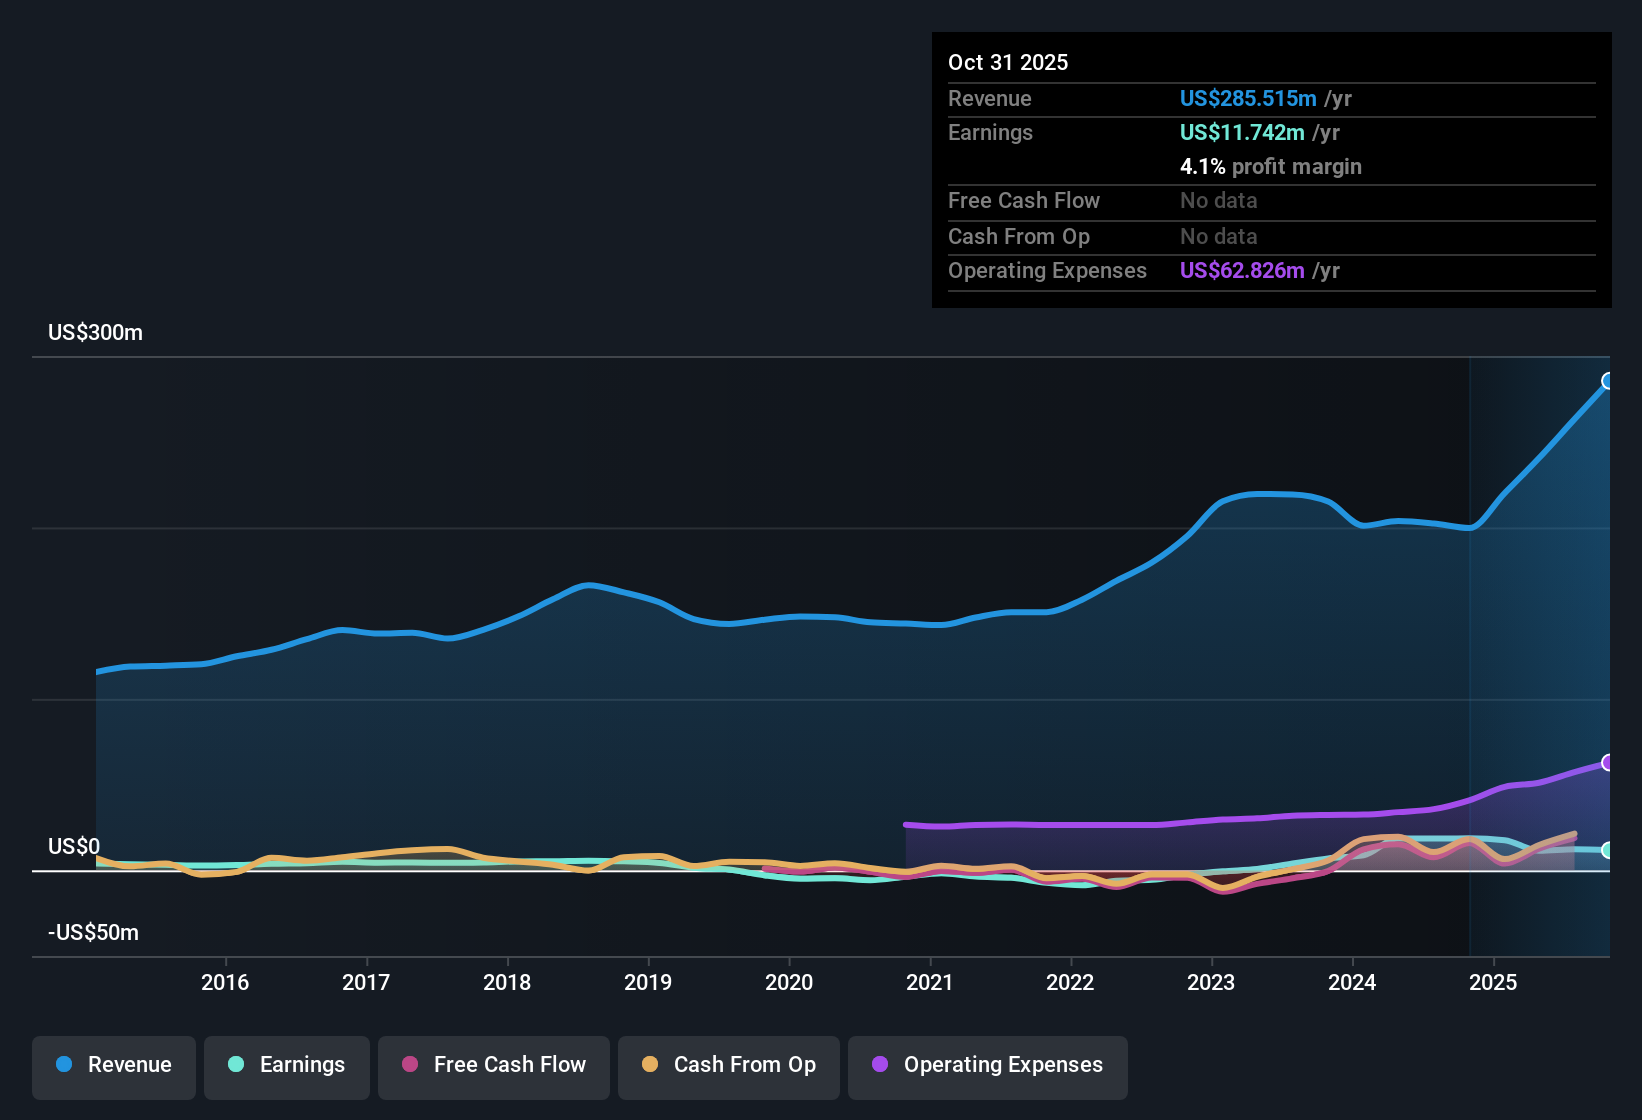
- Net income for Q2 2026 was $2.4 million compared with $4.9 million in Q4 2025, while trailing net margin sits at 4.1%, down from 9.4% a year earlier.
- Bears highlight the lower 4.1% trailing margin and the drop from $4.9 million to $2.4 million in recent quarterly net income as signals that profitability is under pressure,
- Yet over the last five years earnings still grew 63.6% per year, which shows that the business has managed to scale profitably over a longer stretch despite the latest margin compression.
- Trailing 12 month net income of $11.7 million against $285.5 million of revenue confirms the company remains solidly profitable even as margins have come down.
Low 9.3x P/E Versus Strong Five Year Growth
- The stock trades on a trailing P/E of 9.3 times while earnings have grown 63.6% per year over the past five years and trailing 12 month EPS is $4.10.
- Bullish investors argue that combining a 9.3 times earnings multiple with five year earnings growth of 63.6% per year points to a mispriced compounder,
- Supporting that view, the trailing 12 month EPS of $4.10 means the current price around $38.26 values each dollar of recent earnings at a discount to both peers on 18.9 times and the industry on 29.7 times.
- What keeps the bullish case grounded is that trailing 12 month net income of $11.7 million is still well above the most recent single quarter level of $2.4 million, which shows profits have been meaningfully higher across the year than the latest snapshot alone might suggest.
DCF Fair Value Far Above Market Price
- The shares change hands at $38.26, which is 67.2% below a DCF fair value of about $116.81, implying a large valuation gap based on cash flow estimates.
- What stands out for value focused investors is that this discount comes alongside flagged balance sheet and governance risks,
- The analysis notes a high level of debt and significant insider selling over the last three months, which helps explain why the market might hesitate despite the 67.2% gap to DCF fair value.
- At the same time, trailing 12 month earnings of $11.7 million and high labeled earnings quality suggest that the cash flows underpinning that DCF are based on profitable operations rather than one off gains.
Next Steps
Don't just look at this quarter; the real story is in the long-term trend. We've done an in-depth analysis on Kewaunee Scientific's growth and its valuation to see if today's price is a bargain. Add the company to your watchlist or portfolio now so you don't miss the next big move.
See What Else Is Out There
Kewaunee Scientific’s compressed margins, higher leverage and recent insider selling suggest profitability and balance sheet strength may not fully support its apparently attractive valuation.
If those pressure points give you pause, use our solid balance sheet and fundamentals stocks screener (1943 results) to quickly shift your focus toward businesses with stronger finances and more resilient earnings power.
This article by Simply Wall St is general in nature. We provide commentary based on historical data and analyst forecasts only using an unbiased methodology and our articles are not intended to be financial advice. It does not constitute a recommendation to buy or sell any stock, and does not take account of your objectives, or your financial situation. We aim to bring you long-term focused analysis driven by fundamental data. Note that our analysis may not factor in the latest price-sensitive company announcements or qualitative material. Simply Wall St has no position in any stocks mentioned.
Have feedback on this article? Concerned about the content? Get in touch with us directly. Alternatively, email editorial-team@simplywallst.com