
After losing 28% in the past year, Nitori Holdings Co., Ltd. (TSE:9843) institutional owners must be relieved by the recent gain
Key Insights
- Institutions' substantial holdings in Nitori Holdings implies that they have significant influence over the company's share price
- The top 8 shareholders own 52% of the company
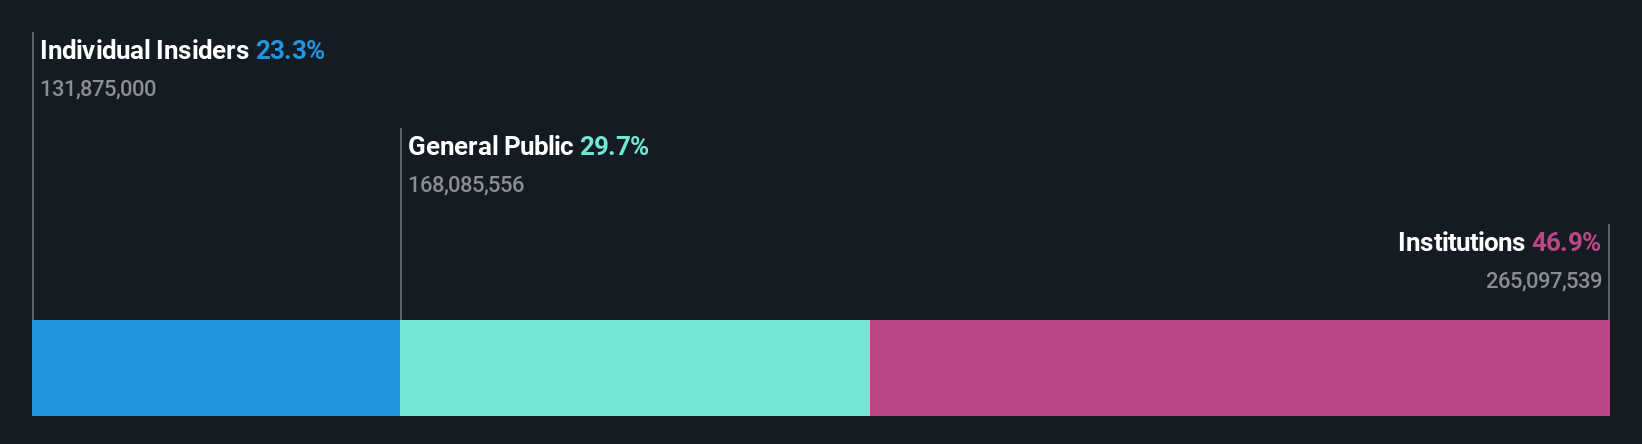
- Insider ownership in Nitori Holdings is 23%
Every investor in Nitori Holdings Co., Ltd. (TSE:9843) should be aware of the most powerful shareholder groups. And the group that holds the biggest piece of the pie are institutions with 47% ownership. That is, the group stands to benefit the most if the stock rises (or lose the most if there is a downturn).
Institutional investors would appreciate the 4.2% increase in share price last week, given their one-year losses have totalled a disappointing 28%.
Let's delve deeper into each type of owner of Nitori Holdings, beginning with the chart below.
View our latest analysis for Nitori Holdings
What Does The Institutional Ownership Tell Us About Nitori Holdings?
Institutional investors commonly compare their own returns to the returns of a commonly followed index. So they generally do consider buying larger companies that are included in the relevant benchmark index.
As you can see, institutional investors have a fair amount of stake in Nitori Holdings. This implies the analysts working for those institutions have looked at the stock and they like it. But just like anyone else, they could be wrong. If multiple institutions change their view on a stock at the same time, you could see the share price drop fast. It's therefore worth looking at Nitori Holdings' earnings history below. Of course, the future is what really matters.

Nitori Holdings is not owned by hedge funds. The company's CEO Akio Nitori is the largest shareholder with 23% of shares outstanding. Nomura Asset Management Co., Ltd. is the second largest shareholder owning 6.4% of common stock, and BlackRock, Inc. holds about 5.2% of the company stock.
We did some more digging and found that 8 of the top shareholders account for roughly 52% of the register, implying that along with larger shareholders, there are a few smaller shareholders, thereby balancing out each others interests somewhat.
Researching institutional ownership is a good way to gauge and filter a stock's expected performance. The same can be achieved by studying analyst sentiments. There are plenty of analysts covering the stock, so it might be worth seeing what they are forecasting, too.
Insider Ownership Of Nitori Holdings
The definition of an insider can differ slightly between different countries, but members of the board of directors always count. Company management run the business, but the CEO will answer to the board, even if he or she is a member of it.
Insider ownership is positive when it signals leadership are thinking like the true owners of the company. However, high insider ownership can also give immense power to a small group within the company. This can be negative in some circumstances.
It seems insiders own a significant proportion of Nitori Holdings Co., Ltd.. Insiders own JP¥375b worth of shares in the JP¥1.6t company. That's quite meaningful. It is good to see this level of investment. You can check here to see if those insiders have been buying recently.
General Public Ownership
With a 30% ownership, the general public, mostly comprising of individual investors, have some degree of sway over Nitori Holdings. While this group can't necessarily call the shots, it can certainly have a real influence on how the company is run.
Next Steps:
While it is well worth considering the different groups that own a company, there are other factors that are even more important.
I like to dive deeper into how a company has performed in the past. You can access this interactive graph of past earnings, revenue and cash flow, for free.
Ultimately the future is most important. You can access this free report on analyst forecasts for the company.
NB: Figures in this article are calculated using data from the last twelve months, which refer to the 12-month period ending on the last date of the month the financial statement is dated. This may not be consistent with full year annual report figures.
Have feedback on this article? Concerned about the content? Get in touch with us directly. Alternatively, email editorial-team (at) simplywallst.com.
This article by Simply Wall St is general in nature. We provide commentary based on historical data and analyst forecasts only using an unbiased methodology and our articles are not intended to be financial advice. It does not constitute a recommendation to buy or sell any stock, and does not take account of your objectives, or your financial situation. We aim to bring you long-term focused analysis driven by fundamental data. Note that our analysis may not factor in the latest price-sensitive company announcements or qualitative material. Simply Wall St has no position in any stocks mentioned.