
Does MSA Safety’s Recent Share Price Dip Offer Long Term Value in 2025?
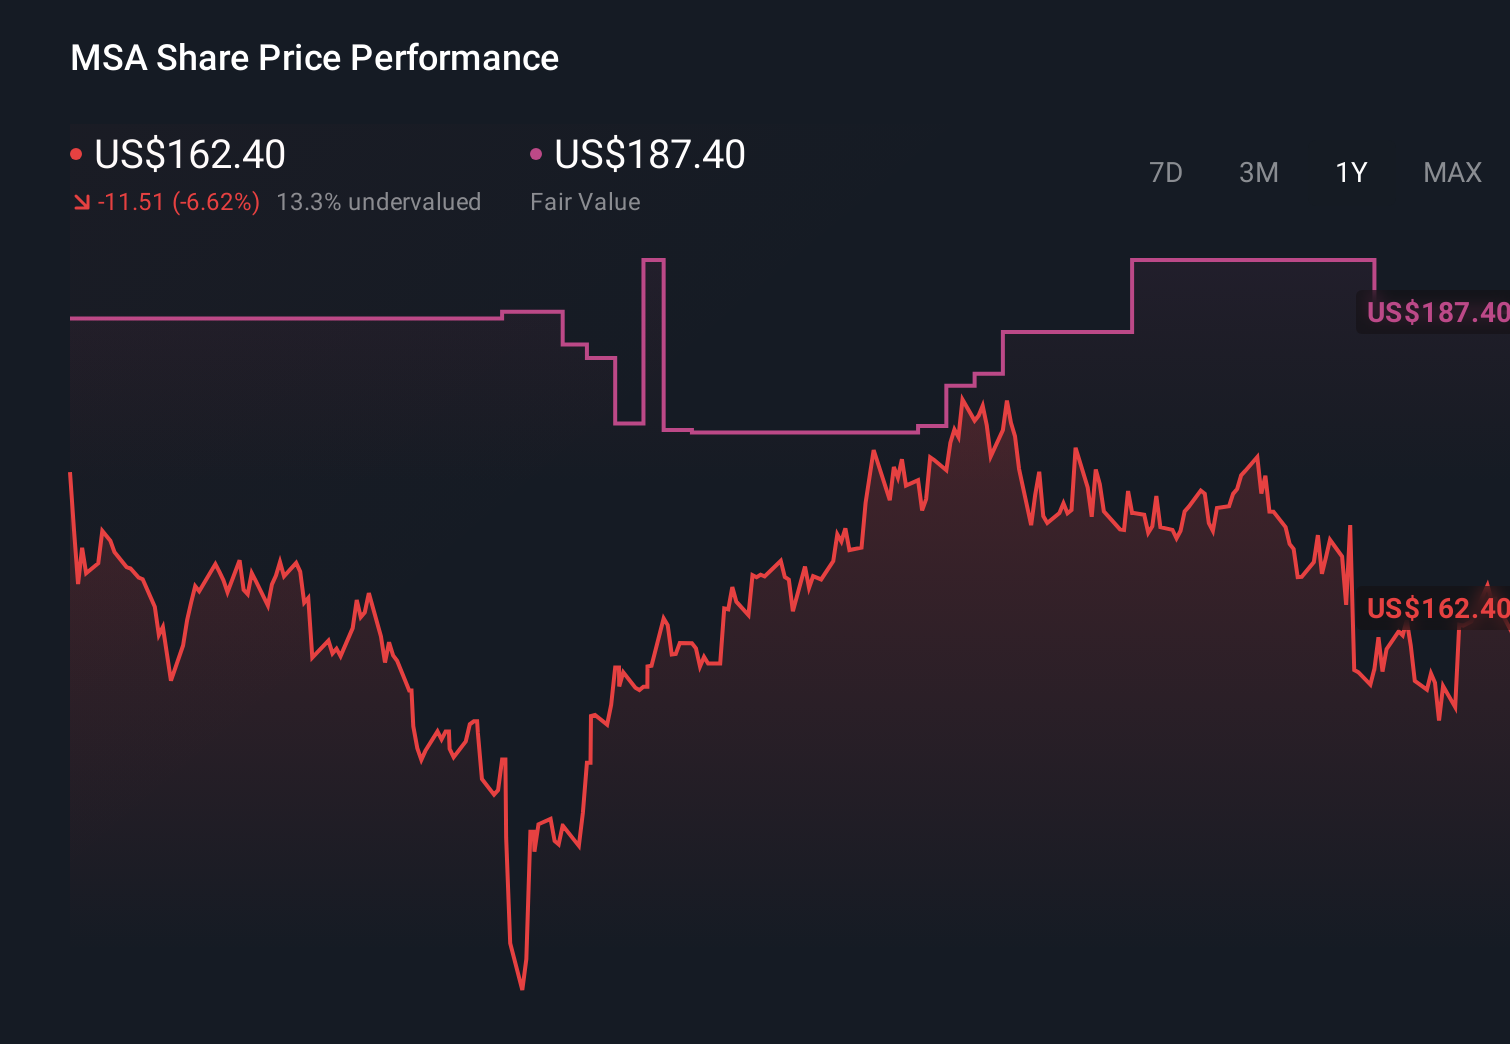
- Wondering if MSA Safety at around $163.97 is quietly becoming good value, or if the market already sees its best days? This article will walk through what the numbers are really saying.
- Despite being down about 5.8% over the last year and slightly negative year to date, the stock has still delivered roughly 28.8% over three years and 15.5% over five, suggesting the long term story is not as weak as the recent patch implies.
- Recent attention around workplace safety standards and renewed infrastructure and industrial spending in the US has kept MSA Safety in the conversation as a core supplier of protective equipment and gas detection systems. At the same time, ongoing regulatory focus on worker protection globally has reinforced the idea that its demand backdrop is more structural than cyclical, helping explain some of the resilience in the share price.
- Right now, MSA Safety scores a 4/6 valuation check score, which hints at pockets of undervaluation that we will unpack using multiple methods, before circling back at the end to an even better way to think about what the stock is really worth.
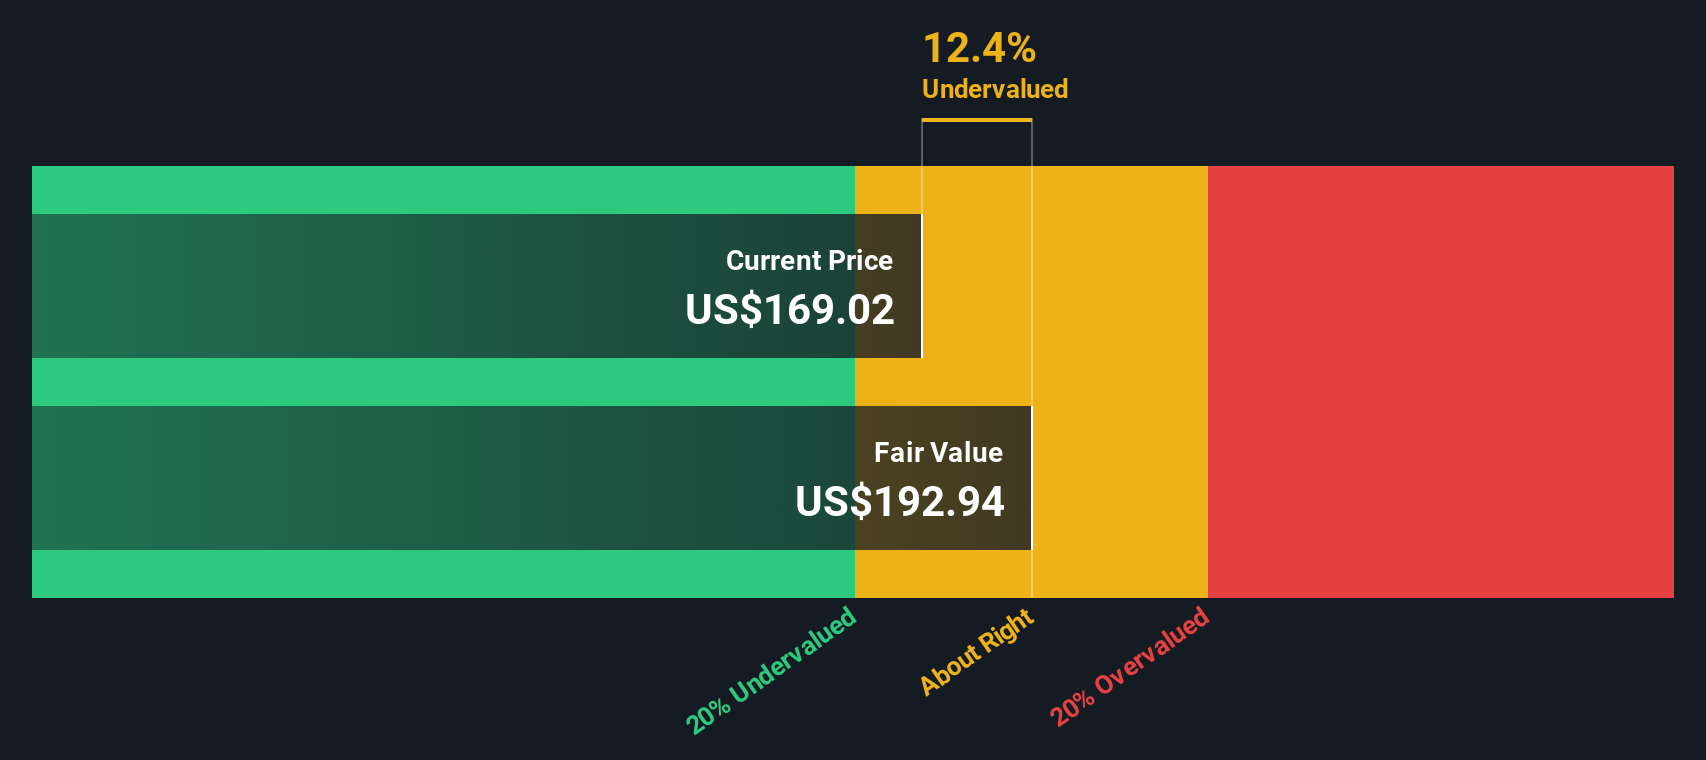
Approach 1: MSA Safety Discounted Cash Flow (DCF) Analysis
A Discounted Cash Flow (DCF) model estimates what a business is worth today by projecting the cash it can generate in the future and discounting those dollars back to their value in the present.
For MSA Safety, the model starts with last twelve month Free Cash Flow of about $293.2 million and uses analyst forecasts for the next few years, then extrapolates further out to 2035. Under this 2 Stage Free Cash Flow to Equity approach, Free Cash Flow is projected to rise to roughly $412.5 million in 10 years, reflecting steady but not explosive growth as the company matures.
When all those projected cash flows are discounted back to today, the DCF model arrives at an intrinsic value of about $208.36 per share, compared with the current share price near $163.97. That implies MSA Safety is trading at roughly a 21.3% discount to its estimated fair value. This suggests the market is not fully pricing in its future cash generation.
Result: UNDERVALUED
Our Discounted Cash Flow (DCF) analysis suggests MSA Safety is undervalued by 21.3%. Track this in your watchlist or portfolio, or discover 905 more undervalued stocks based on cash flows.
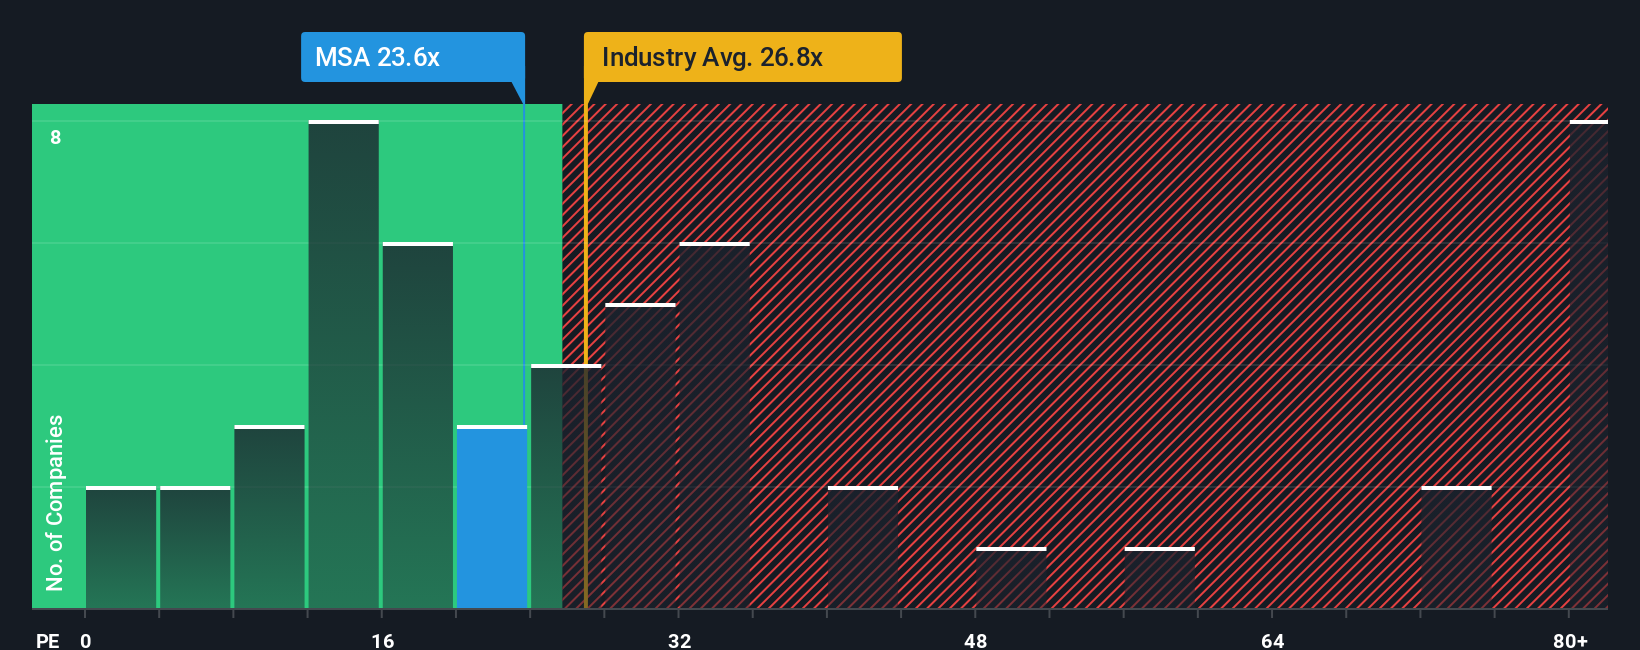
Approach 2: MSA Safety Price vs Earnings
For a consistently profitable business like MSA Safety, the Price to Earnings (PE) ratio is a useful way to judge value because it directly links what investors pay today to the profits the company is generating right now.
What counts as a fair PE depends on how fast earnings are expected to grow and how risky those earnings are. Higher growth and stronger resilience typically justify a higher multiple, while slower or more volatile businesses usually deserve a lower one.
MSA Safety currently trades on about 22.94x earnings. That is below the broader Commercial Services industry average of roughly 24.87x, but above the peer group average of around 17.60x, which might initially look a bit rich versus similar names.
Simply Wall St’s Fair Ratio framework goes a step further by estimating what PE MSA should trade on, given its earnings growth profile, margins, industry, market cap and risk factors. For MSA, that Fair Ratio is about 24.10x, slightly higher than where the stock trades now. This indicates the market is pricing MSA a little below what its fundamentals would normally warrant.
Result: UNDERVALUED
PE ratios tell one story, but what if the real opportunity lies elsewhere? Discover 1445 companies where insiders are betting big on explosive growth.
Upgrade Your Decision Making: Choose your MSA Safety Narrative
Earlier we mentioned that there is an even better way to understand valuation, so let us introduce you to Narratives, a simple way to attach your story about MSA Safety, including your assumptions for fair value, future revenue, earnings and margins, to the numbers you see on the screen.
A Narrative connects three things in one place: what you believe about the business, the financial forecast that follows from that belief, and the fair value that drops out of those assumptions, so you can see whether the current share price looks attractive or not.
On Simply Wall St, Narratives live inside the Community page, where millions of investors can quickly create and adjust them, then compare the resulting Fair Value against today’s Price to decide whether they want to buy, hold or sell.
Because Narratives are dynamic, they automatically refresh when new information arrives, from earnings releases to product launches and management changes, so your view on MSA Safety evolves as the facts change.
For example, one investor might build a bullish MSA Safety Narrative around high adoption of connected safety solutions, margin expansion and a fair value near $187.40. A more cautious investor could assume weaker core demand, more margin pressure and a meaningfully lower fair value, and both can immediately see how their outlook compares with the current market price.
Do you think there's more to the story for MSA Safety? Head over to our Community to see what others are saying!
This article by Simply Wall St is general in nature. We provide commentary based on historical data and analyst forecasts only using an unbiased methodology and our articles are not intended to be financial advice. It does not constitute a recommendation to buy or sell any stock, and does not take account of your objectives, or your financial situation. We aim to bring you long-term focused analysis driven by fundamental data. Note that our analysis may not factor in the latest price-sensitive company announcements or qualitative material. Simply Wall St has no position in any stocks mentioned.
Have feedback on this article? Concerned about the content? Get in touch with us directly. Alternatively, email editorial-team@simplywallst.com