
Assessing First National of Nebraska’s (FINN) Valuation Following Its Newly Announced Special Dividend
First National of Nebraska (FINN) just announced a sizable special dividend, declaring $235 per share payable on December 23, with the ex-dividend and record date both set for December 18.
See our latest analysis for First National of Nebraska.
That payout lands on top of a strong backdrop, with the latest share price at $14,565.0 and a year to date share price return of 24.49%. The five year total shareholder return of 38.69% suggests steady, rather than explosive, momentum.
If this special dividend has you thinking about how banks fit into your portfolio, it could also be a good moment to explore fast growing stocks with high insider ownership for other compelling ideas.
With shares already up strongly this year and a hefty special dividend on the way, the real question now is whether First National of Nebraska still trades below its true value or if markets are already pricing in future growth.
Price-to-Earnings of 10.1x: Is it justified?
On a trailing price-to-earnings ratio of 10.1 times, First National of Nebraska screens as cheaper than many peers despite its $14,565 last close.
The price-to-earnings multiple compares the current share price with the company’s earnings per share, making it a straightforward yardstick for how much investors pay for each dollar of profit, especially relevant for profitable, mature banks.
In FINN’s case, a 10.1 times earnings multiple appears modest when set against both the broader US market at 18.9 times and the US banks sector at 11.9 times. This suggests that the market may be attaching a discount despite faster recent earnings growth and solid net profit margins.
Relative to sector and market benchmarks, this gap is not marginal; it is a clear valuation step down that indicates investors may be underpricing the bank’s current earnings power and its recent acceleration in profitability.
See what the numbers say about this price — find out in our valuation breakdown.
Result: Price-to-Earnings of 10.1x (UNDERVALUED)
However, the picture could change if credit quality weakens in a downturn or if regulatory shifts compress margins faster than management can offset.
Find out about the key risks to this First National of Nebraska narrative.
Another View: Our DCF Model Points the Other Way
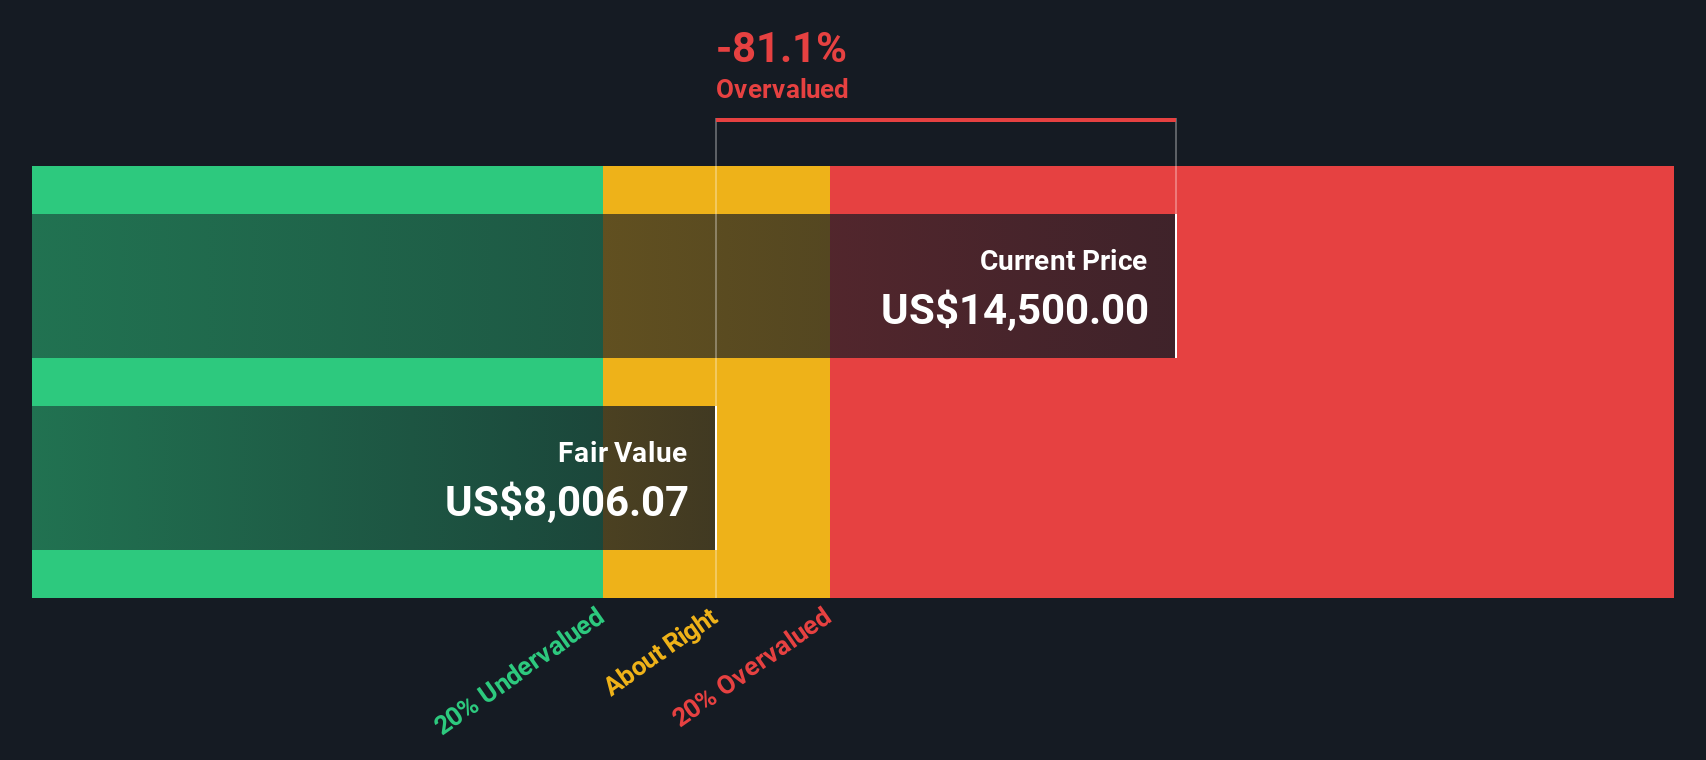
Our DCF model tells a very different story, suggesting First National of Nebraska is trading well above estimated fair value, with the current $14,565 price sitting significantly higher than our $6,489.81 fair value estimate and implying meaningful overvaluation on cash flow assumptions.
This clash between a cheap looking earnings multiple and a rich DCF outcome raises a practical question for investors: do you trust today’s earnings power to persist, or side with a more conservative long term cash flow view?
Look into how the SWS DCF model arrives at its fair value.
Simply Wall St performs a discounted cash flow (DCF) on every stock in the world every day (check out First National of Nebraska for example). We show the entire calculation in full. You can track the result in your watchlist or portfolio and be alerted when this changes, or use our stock screener to discover 904 undervalued stocks based on their cash flows. If you save a screener we even alert you when new companies match - so you never miss a potential opportunity.
Build Your Own First National of Nebraska Narrative
If you see the numbers differently, or simply want to dig into the details yourself, you can build a custom view in just minutes: Do it your way.
A great starting point for your First National of Nebraska research is our analysis highlighting 2 key rewards and 3 important warning signs that could impact your investment decision.
Ready for more investment ideas?
If you stop with just one stock, you risk missing out on sharper opportunities. Use the Simply Wall Street Screener to target themes that match your strategy.
- Capture potential market mispricings by hunting through these 904 undervalued stocks based on cash flows that strong cash flow analysis suggests the market has overlooked.
- Position ahead of the next innovation wave by selecting from these 25 AI penny stocks pushing real world breakthroughs in automation and intelligent software.
- Lock in more reliable income streams by focusing on these 12 dividend stocks with yields > 3% that may strengthen long term total returns.
This article by Simply Wall St is general in nature. We provide commentary based on historical data and analyst forecasts only using an unbiased methodology and our articles are not intended to be financial advice. It does not constitute a recommendation to buy or sell any stock, and does not take account of your objectives, or your financial situation. We aim to bring you long-term focused analysis driven by fundamental data. Note that our analysis may not factor in the latest price-sensitive company announcements or qualitative material. Simply Wall St has no position in any stocks mentioned.
Have feedback on this article? Concerned about the content? Get in touch with us directly. Alternatively, email editorial-team@simplywallst.com