
Taking Stock of Stryker (SYK) Valuation After Its Latest Dividend Increase and Confident Outlook
Stryker (SYK) just gave income focused investors something to chew on, lifting its quarterly dividend by 5% and pairing that move with confident commentary around cash generation and long term earnings power.
See our latest analysis for Stryker.
The move comes after a softer patch in the stock, with a roughly 8 percent 3 month share price return and a slightly negative 1 year total shareholder return. However, the 3 year total shareholder return above 48 percent suggests longer term momentum is still intact, and this dividend lift may help rebuild confidence.
If Stryker’s combination of resilience and income appeal has your attention, it could be a good moment to explore other quality names in healthcare via healthcare stocks.
Yet with the shares lagging the broader market despite solid double digit organic growth and a higher dividend, is Stryker quietly slipping into undervalued territory, or is the market already discounting years of future expansion?
Most Popular Narrative Narrative: 18.5% Undervalued
With Stryker last closing at $352.97 against a narrative fair value near $433, the story hinges on sustained growth and improving profitability over time.
Robust innovation pipeline, particularly in robotic-assisted surgery (Mako platform) and next-generation devices, is driving greater market share, higher average selling prices, and service revenues, which is expected to accelerate both revenue and margin expansion over time.
Want to see what powers that confidence in rising earnings and margins? The narrative focuses on ambitious growth, a richer business mix, and a premium future valuation multiple.
Result: Fair Value of $433.19 (UNDERVALUED)
Have a read of the narrative in full and understand what's behind the forecasts.
However, supply chain strains and prolonged regulatory delays in key markets could curb Stryker’s growth trajectory and challenge the upbeat valuation narrative.
Find out about the key risks to this Stryker narrative.
Another View: Rich Valuation on Earnings
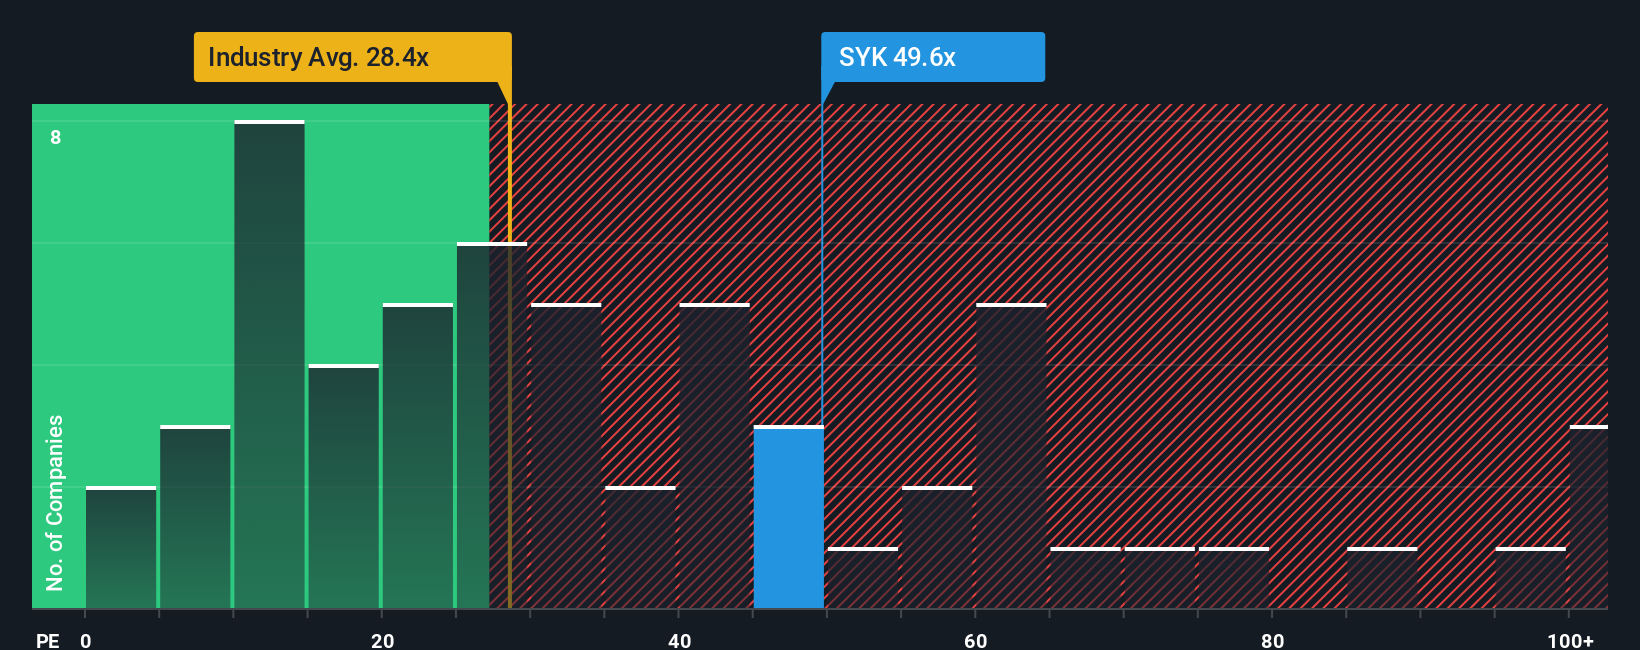
While the narrative suggests upside to fair value, the earnings based view looks stretched. Stryker trades on a P/E of 45.9 times, versus 40.4 times for peers and a fair ratio of 37.1 times. This points to valuation risk if growth or sentiment cools.
See what the numbers say about this price — find out in our valuation breakdown.
Build Your Own Stryker Narrative
If this framework does not fit your view, or you prefer to dig into the numbers yourself, you can build a custom narrative in minutes: Do it your way.
A great starting point for your Stryker research is our analysis highlighting 2 key rewards and 3 important warning signs that could impact your investment decision.
Looking for more investment ideas?
Before you move on, put Simply Wall Street’s powerful Screener to work so you do not miss high quality opportunities hiding beyond Stryker.
- Capture early growth potential by scanning these 25 AI penny stocks that are shaping the future of intelligent automation and data driven business models.
- Secure more dependable income streams by zeroing in on these 12 dividend stocks with yields > 3% that aim to reward patient shareholders year after year.
- Capitalize on market mispricing by targeting these 904 undervalued stocks based on cash flows where strong cash flows are not yet reflected in today’s share prices.
This article by Simply Wall St is general in nature. We provide commentary based on historical data and analyst forecasts only using an unbiased methodology and our articles are not intended to be financial advice. It does not constitute a recommendation to buy or sell any stock, and does not take account of your objectives, or your financial situation. We aim to bring you long-term focused analysis driven by fundamental data. Note that our analysis may not factor in the latest price-sensitive company announcements or qualitative material. Simply Wall St has no position in any stocks mentioned.
Have feedback on this article? Concerned about the content? Get in touch with us directly. Alternatively, email editorial-team@simplywallst.com