
Does American Airlines Look Attractive After Recent Share Price Rebound?
- If you are wondering whether American Airlines Group at around $14.96 is a bargain or a value trap, this breakdown is designed to help you evaluate the stock with a clear, measured view.
- Despite being down about 12.0% year to date and 13.2% over the last year, the share price has risen 4.3% in the past week and 15.2% over the last month, which indicates that sentiment may be starting to shift.
- Investors have been reacting to a mix of macro signals and sector headlines, including shifting travel demand patterns and ongoing debates about fuel costs and capacity planning across major U.S. carriers. Together, these factors have reshaped expectations around what a sustainable earnings and cash flow profile for American Airlines Group might look like.
- At present, American Airlines Group scores a 4/6 valuation check. This suggests it screens as undervalued on most of the key measures tracked in that framework. Next, the underlying methods can be unpacked before moving to a more holistic way of assessing what the stock may realistically be worth.
Find out why American Airlines Group's -13.2% return over the last year is lagging behind its peers.
Approach 1: American Airlines Group Discounted Cash Flow (DCF) Analysis
A Discounted Cash Flow model estimates what a business is worth today by taking projections of its future cash flows and discounting them back to the present. For American Airlines Group, this 2 Stage Free Cash Flow to Equity model starts with its last twelve months Free Cash Flow of about $1.03 billion and then projects how that cash flow could grow over time.
Analyst estimates and extrapolations suggest Free Cash Flow could rise to roughly $4.85 billion by 2035, with interim projections such as $0.49 billion in 2026, $1.31 billion in 2028 and just over $2.03 billion by 2029. Simply Wall St uses analyst inputs for the earlier years and then extends those trends further out, reflecting a gradual slowdown in growth as the business matures.
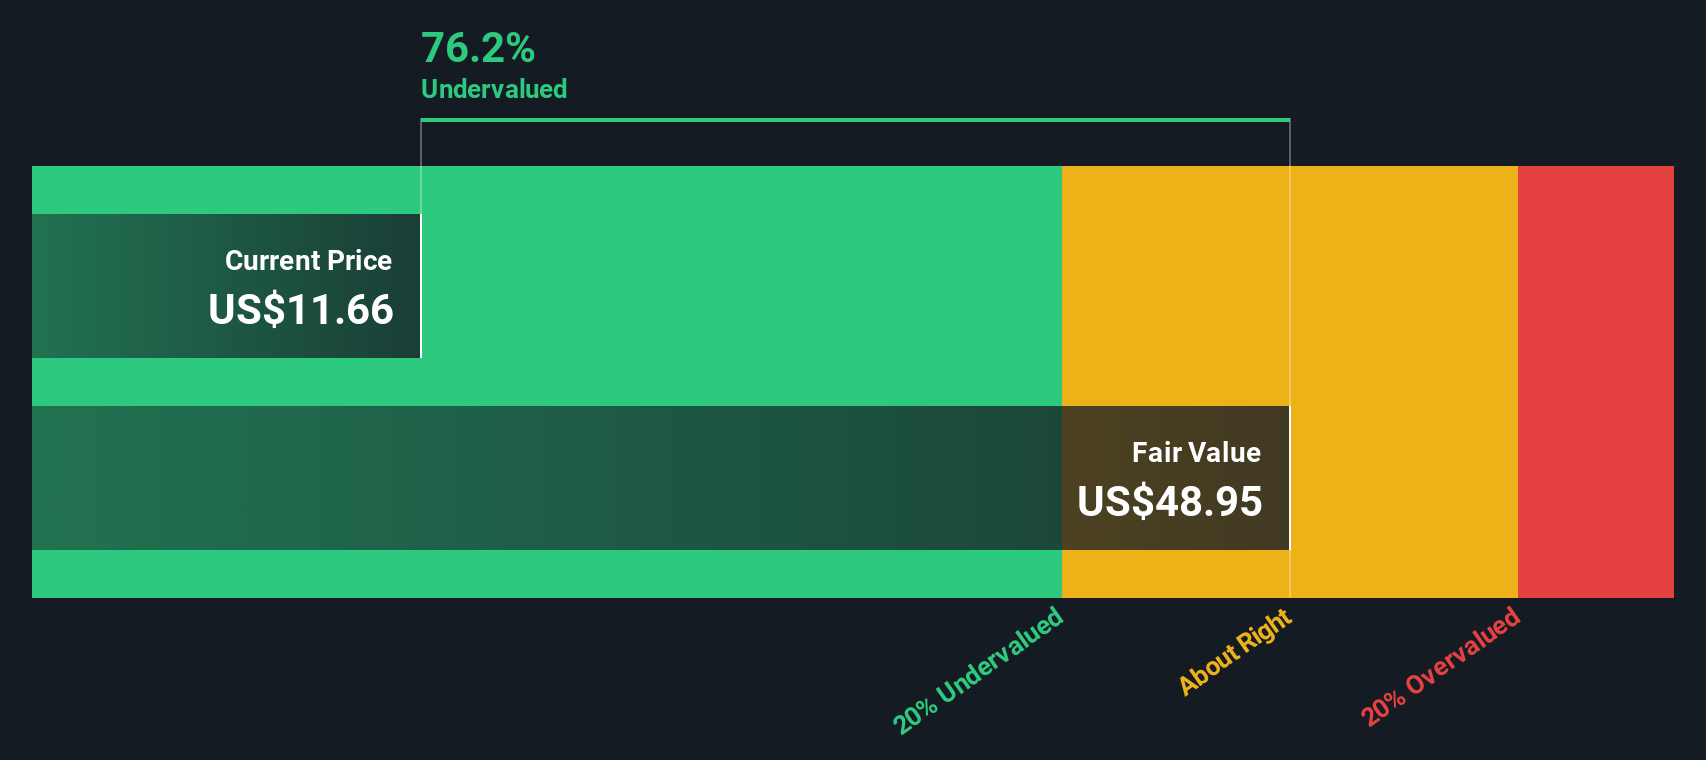
When all of these future cash flows are discounted back to today, the model arrives at an intrinsic value of about $44.52 per share. Against a recent share price around $14.96, the DCF implies the stock is roughly 66.4% undervalued. This indicates that investors are heavily discounting the company’s ability to sustain and grow cash generation.
Result: UNDERVALUED
Our Discounted Cash Flow (DCF) analysis suggests American Airlines Group is undervalued by 66.4%. Track this in your watchlist or portfolio, or discover 904 more undervalued stocks based on cash flows.
Approach 2: American Airlines Group Price vs Earnings
For companies that are generating profits, the price to earnings multiple is a straightforward way to connect what you pay for the stock with what the business is currently earning. A higher PE usually reflects stronger growth expectations or lower perceived risk, while a lower PE can signal slower growth, higher uncertainty or a market that is skeptical about the durability of earnings.
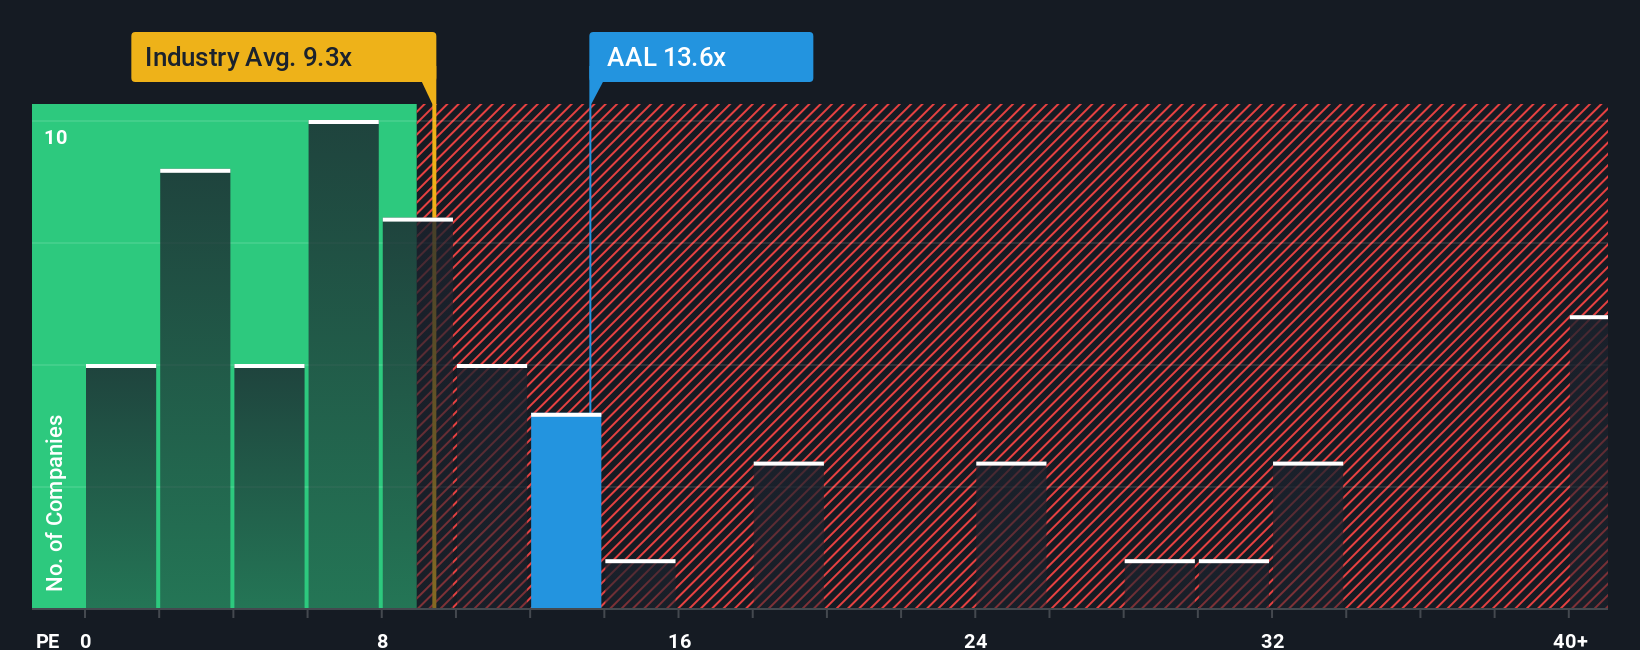
American Airlines Group currently trades on a PE of about 16.4x. That is well above the Airlines industry average of roughly 9.3x, but below the broader peer group average of around 28.4x. To move beyond these blunt comparisons, Simply Wall St uses a proprietary Fair Ratio. This estimates what a reasonable PE should be once factors like earnings growth, industry dynamics, profit margins, market cap and company specific risks are taken into account.
For American Airlines Group, this Fair Ratio is calculated at about 24.0x. This means the shares trade at a discount to where they might sit if the market fully priced in those fundamentals. On this basis, the stock looks undervalued relative to its Fair Ratio.
Result: UNDERVALUED
PE ratios tell one story, but what if the real opportunity lies elsewhere? Discover 1446 companies where insiders are betting big on explosive growth.
Upgrade Your Decision Making: Choose your American Airlines Group Narrative
Earlier we mentioned that there is an even better way to understand valuation, so let us introduce you to Narratives, a simple way to connect your view of a company’s future with the numbers behind its fair value.
A Narrative is the story you believe about a business, translated into concrete assumptions about its future revenue, earnings and margins, which are then used to calculate a fair value estimate.
On Simply Wall St’s Community page, Narratives are an easy, accessible tool used by millions of investors to link a company’s story to a financial forecast, then compare the resulting Fair Value to today’s share price to help decide whether it might be time to buy, hold or sell.
Because Narratives are updated dynamically when fresh information arrives, such as earnings reports or major news, your fair value view can evolve as the facts change without you having to rebuild everything from scratch.
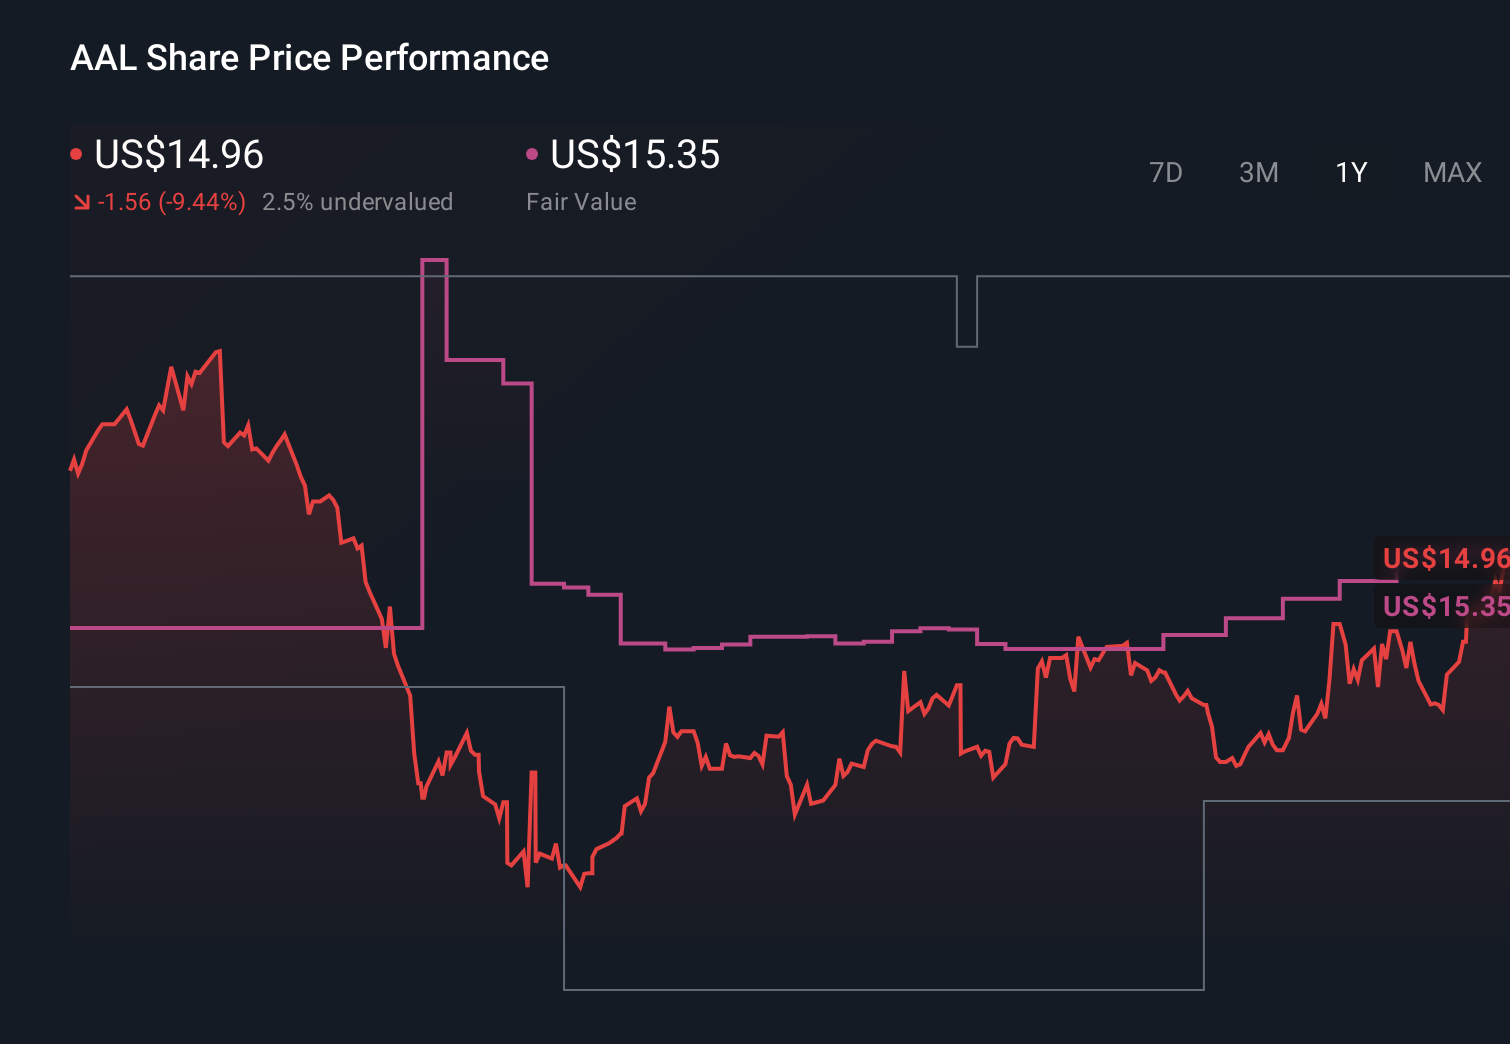
For American Airlines Group, one investor Narrative might focus on balance sheet risk and assign a fair value around $10.61. Another might highlight improving demand, loyalty growth and fleet efficiency to justify a higher fair value close to $15.35. This shows how different perspectives on the same company can lead to very different, yet structured, investment decisions.
For American Airlines Group, we will make it really easy for you with previews of two leading American Airlines Group Narratives:
🐂 American Airlines Group Bull Case
Fair value in this narrative is $15.35 per share.
At a recent share price of $14.96, this view implies the stock is about 2.5% undervalued relative to that fair value.
Expected revenue growth used in this narrative is approximately 4.96% per year.
- Assumes steady domestic demand recovery, premium product upgrades, and loyalty expansion will support gradually improving margins and more stable earnings.
- Factors in structural tailwinds from AAdvantage membership growth, the new long term Citi card deal, and more fuel efficient aircraft to enhance free cash flow over time.
- Recognizes material risks from high labor costs, sizeable debt, and operational challenges, but concludes that at around the current price these are broadly reflected, leaving modest upside.
🐻 American Airlines Group Bear Case
Fair value in this narrative is $10.61 per share.
At a recent share price of $14.96, this view suggests the stock is roughly 41.0% overvalued versus that fair value.
Expected revenue growth used in this narrative is approximately 2.5% per year.
- Focuses on American's highly levered balance sheet and negative equity position, arguing that it leaves the company acutely exposed to any demand shock.
- Highlights intensifying competition and pressure on fares and margins if travel demand softens, which could quickly undermine already thin profitability.
- Sees limited investment appeal outside a very strong macro backdrop, viewing the current share price as too optimistic given financial and competitive risks.
Do you think there's more to the story for American Airlines Group? Head over to our Community to see what others are saying!
This article by Simply Wall St is general in nature. We provide commentary based on historical data and analyst forecasts only using an unbiased methodology and our articles are not intended to be financial advice. It does not constitute a recommendation to buy or sell any stock, and does not take account of your objectives, or your financial situation. We aim to bring you long-term focused analysis driven by fundamental data. Note that our analysis may not factor in the latest price-sensitive company announcements or qualitative material. Simply Wall St has no position in any stocks mentioned.
Have feedback on this article? Concerned about the content? Get in touch with us directly. Alternatively, email editorial-team@simplywallst.com