
Does Western Union’s Latest Rebound Signal a Compelling Opportunity in 2025?
- Wondering if Western Union at around $9.61 is a bargain or a value trap? This article will walk you through what the numbers are really saying about the stock.
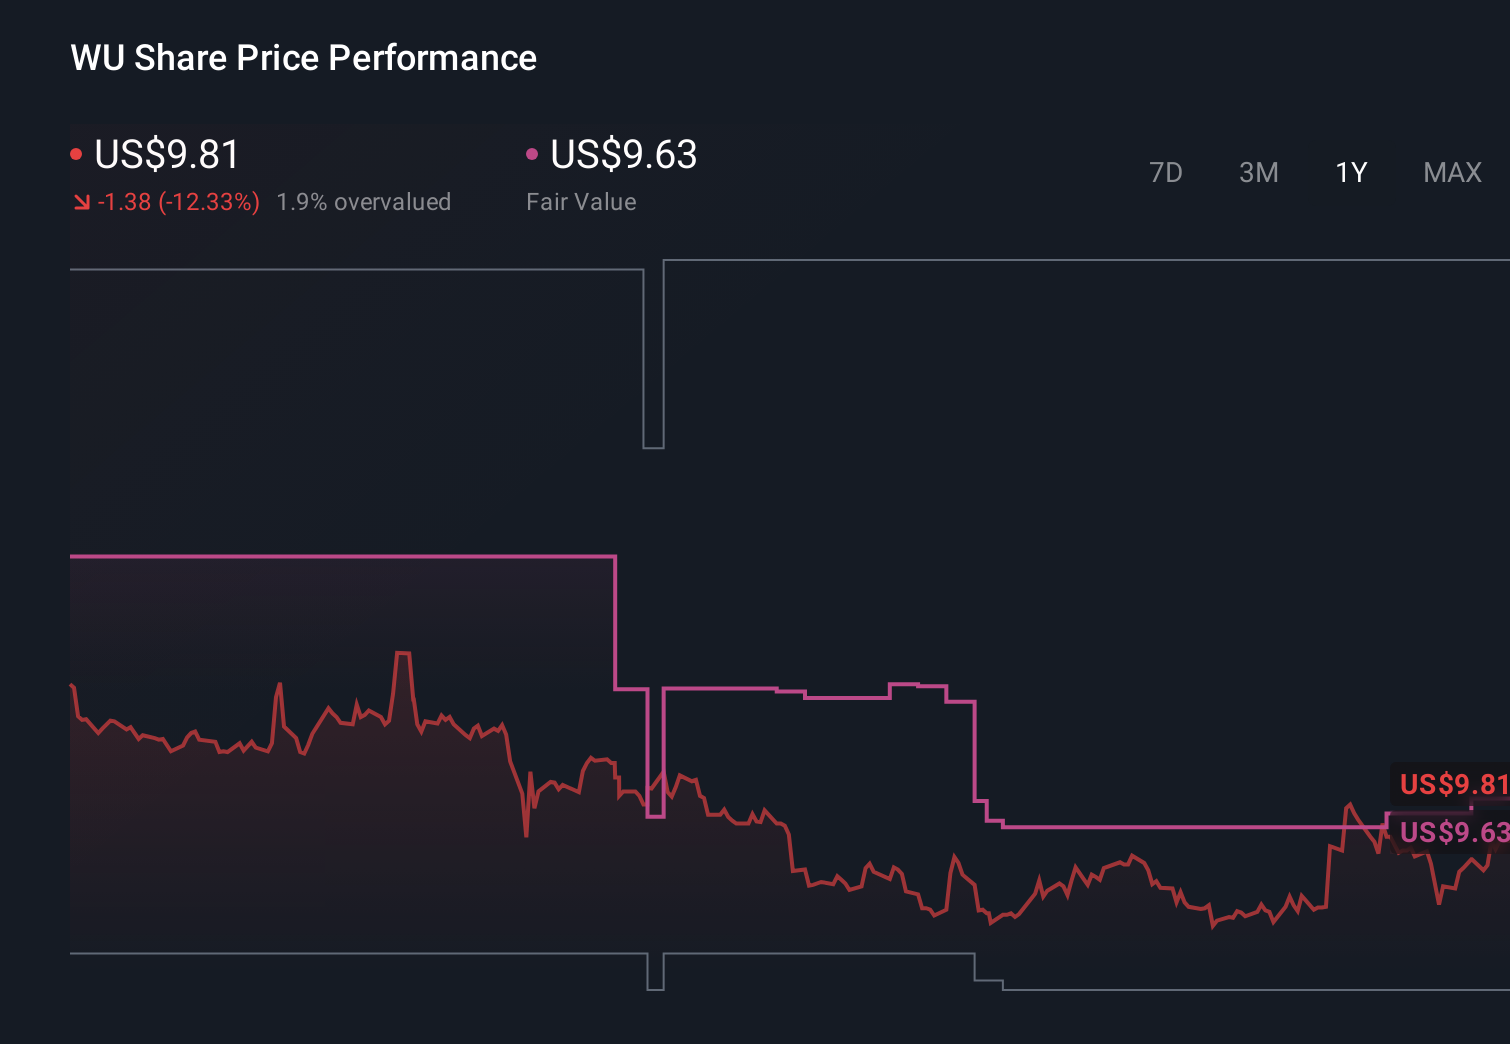
- Despite a tough longer term run, with the share price still down 40.8% over 5 years, the stock has bounced recently, gaining 7.6% over the last week and 7.9% over the past month, even though it remains 8.0% lower year to date and 2.5% down over the last year.
- Part of this shift in sentiment reflects ongoing strategic moves to streamline Western Union's traditional remittance business while investing in digital and cross border payment capabilities. Investors are watching these developments closely as the company adapts to a more competitive fintech landscape. At the same time, changes in macro conditions and regulatory scrutiny around money transfers continue to shape how the market prices Western Union's future cash flows and risk profile.
- On our valuation checks Western Union scores 5/6, signalling it screens as undervalued on most of the key tests we run. We will unpack that valuation score using several approaches before finishing with an even more intuitive way to think about what the stock might really be worth.
Find out why Western Union's -2.5% return over the last year is lagging behind its peers.
Approach 1: Western Union Excess Returns Analysis
The Excess Returns model looks at how much value Western Union creates above the minimum return that equity investors require. Instead of focusing on short term earnings, it evaluates how efficiently the company turns shareholder capital into profits over time.
Western Union has a Book Value of $2.91 per share and a Stable EPS of $1.69 per share, based on weighted future Return on Equity estimates from 6 analysts. With an Average Return on Equity of 50.05% and a Stable Book Value of $3.37 per share, the business is expected to keep generating strong profits from each dollar of equity it employs.
The estimated Cost of Equity is $0.25 per share, while the model calculates an Excess Return of $1.43 per share. In other words, after paying investors their required return, there is still a substantial surplus of economic profit.
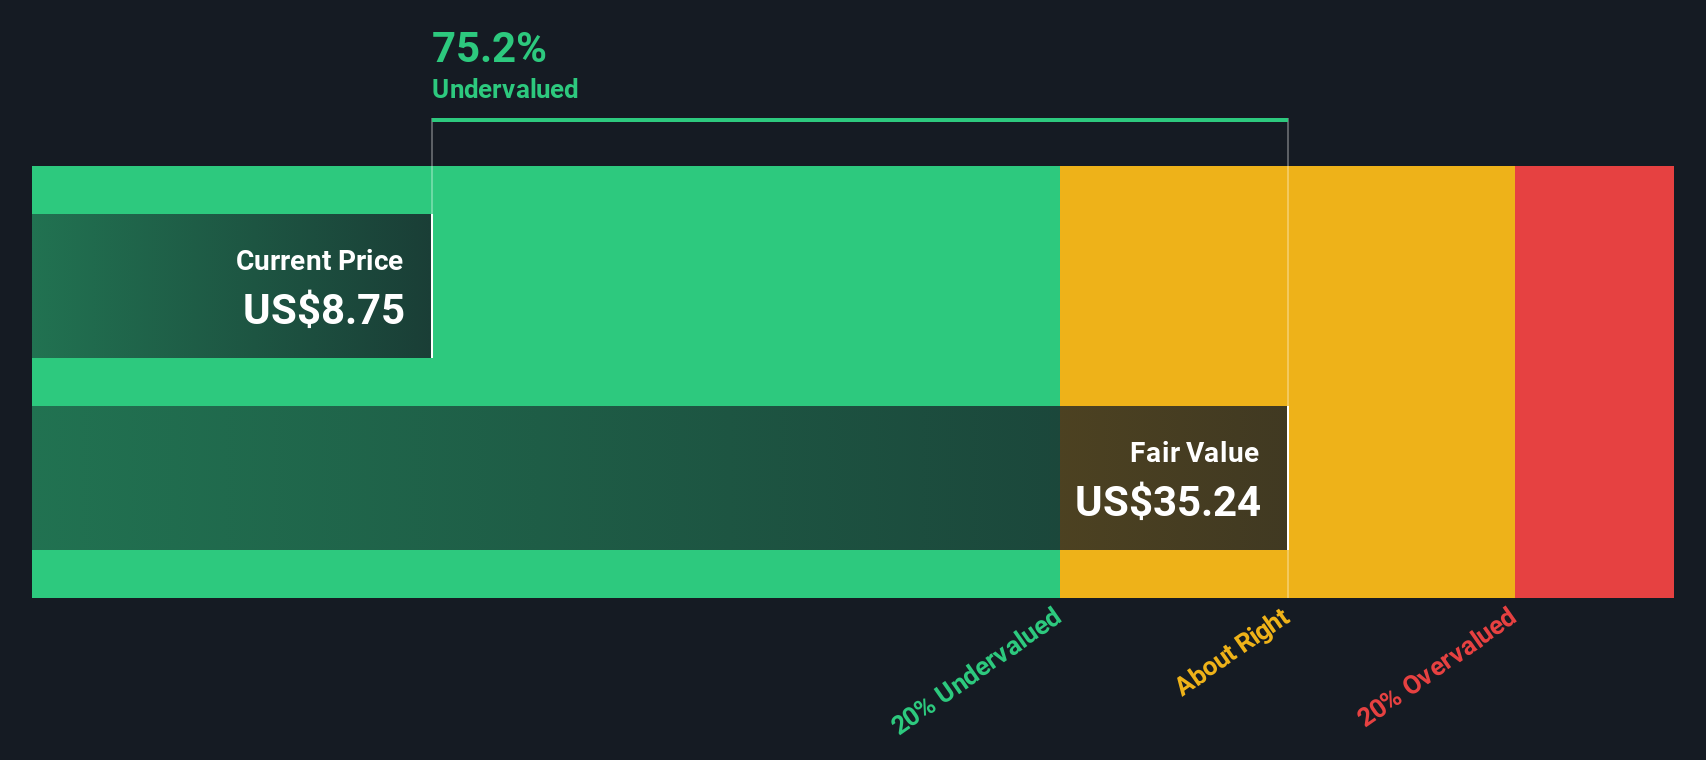
Combining these inputs, the Excess Returns valuation produces an intrinsic value of about $36.76 per share, implying the stock is roughly 73.9% undervalued versus the current price.
Result: UNDERVALUED
Our Excess Returns analysis suggests Western Union is undervalued by 73.9%. Track this in your watchlist or portfolio, or discover 904 more undervalued stocks based on cash flows.
Approach 2: Western Union Price vs Earnings
For profitable, mature businesses like Western Union, the price to earnings, or PE, ratio is a practical way to gauge how much investors are paying for each dollar of current profits. It naturally links today’s share price to the company’s ability to generate earnings right now.
What counts as a “normal” PE largely depends on how fast earnings are expected to grow and how risky those earnings are. Higher growth and lower perceived risk usually justify a higher PE, while slower growth or higher uncertainty point to a lower PE.
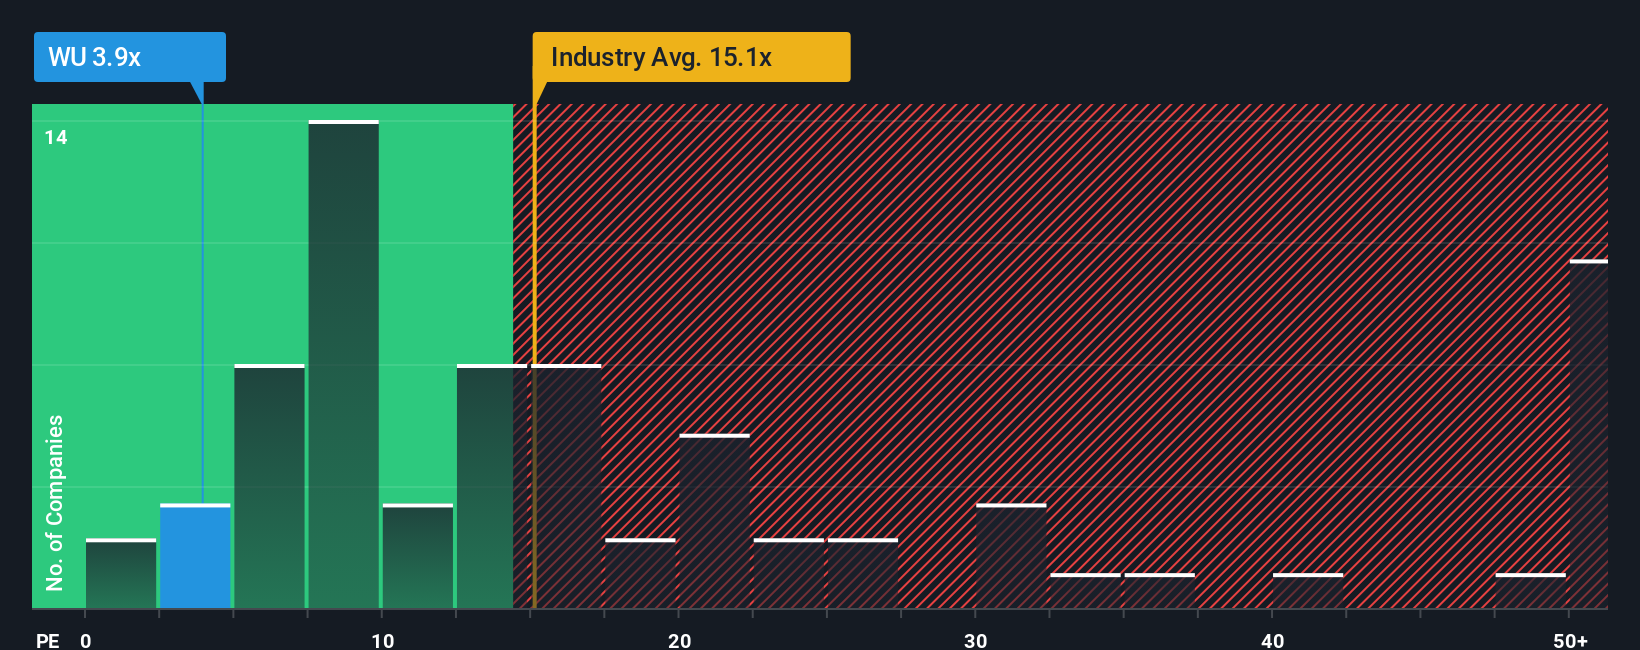
Western Union currently trades at about 4.0x earnings, which is well below both the Diversified Financial industry average of around 13.6x and the broader peer group average of roughly 14.7x. Simply Wall St’s Fair Ratio framework goes a step further by estimating what PE Western Union should trade on, given its specific earnings growth outlook, margins, risk factors, industry and market cap. On this basis, Western Union’s Fair Ratio is 11.4x. Comparing that to the current 4.0x suggests the market is pricing the stock well below what its fundamentals might warrant, indicating meaningful upside if sentiment normalizes.
Result: UNDERVALUED
PE ratios tell one story, but what if the real opportunity lies elsewhere? Discover 1446 companies where insiders are betting big on explosive growth.
Upgrade Your Decision Making: Choose your Western Union Narrative
Earlier we mentioned that there is an even better way to understand valuation, so let's introduce you to Narratives, a simple framework where you attach a clear story about Western Union’s future to the numbers you expect it to deliver, such as revenue, earnings and profit margins. You then link that story to a financial forecast and, ultimately, to a fair value estimate. On Simply Wall St’s Community page, used by millions of investors, you can quickly build or browse Narratives that turn abstract models into an accessible tool for real decisions by comparing each Narrative’s Fair Value with today’s Price to decide whether Western Union might suit a buy, hold, or sell view. Because Narratives automatically update when new earnings, news or guidance arrives, they stay relevant as the facts change. For example, a bullish investor might back a $17 fair value based on expectations of faster digital adoption and margin expansion, while a more cautious investor might anchor closer to $7 if they expect regulatory headwinds and digital competitors to affect growth and profitability.
Do you think there's more to the story for Western Union? Head over to our Community to see what others are saying!
This article by Simply Wall St is general in nature. We provide commentary based on historical data and analyst forecasts only using an unbiased methodology and our articles are not intended to be financial advice. It does not constitute a recommendation to buy or sell any stock, and does not take account of your objectives, or your financial situation. We aim to bring you long-term focused analysis driven by fundamental data. Note that our analysis may not factor in the latest price-sensitive company announcements or qualitative material. Simply Wall St has no position in any stocks mentioned.
Have feedback on this article? Concerned about the content? Get in touch with us directly. Alternatively, email editorial-team@simplywallst.com