
Does Nordson’s Premium Valuation Still Make Sense After Its Strong Multi Year Run?
- If you are wondering whether Nordson is a quietly overvalued industrial name or a sleeper opportunity hiding in plain sight, this breakdown will walk you through what the current price is really implying.
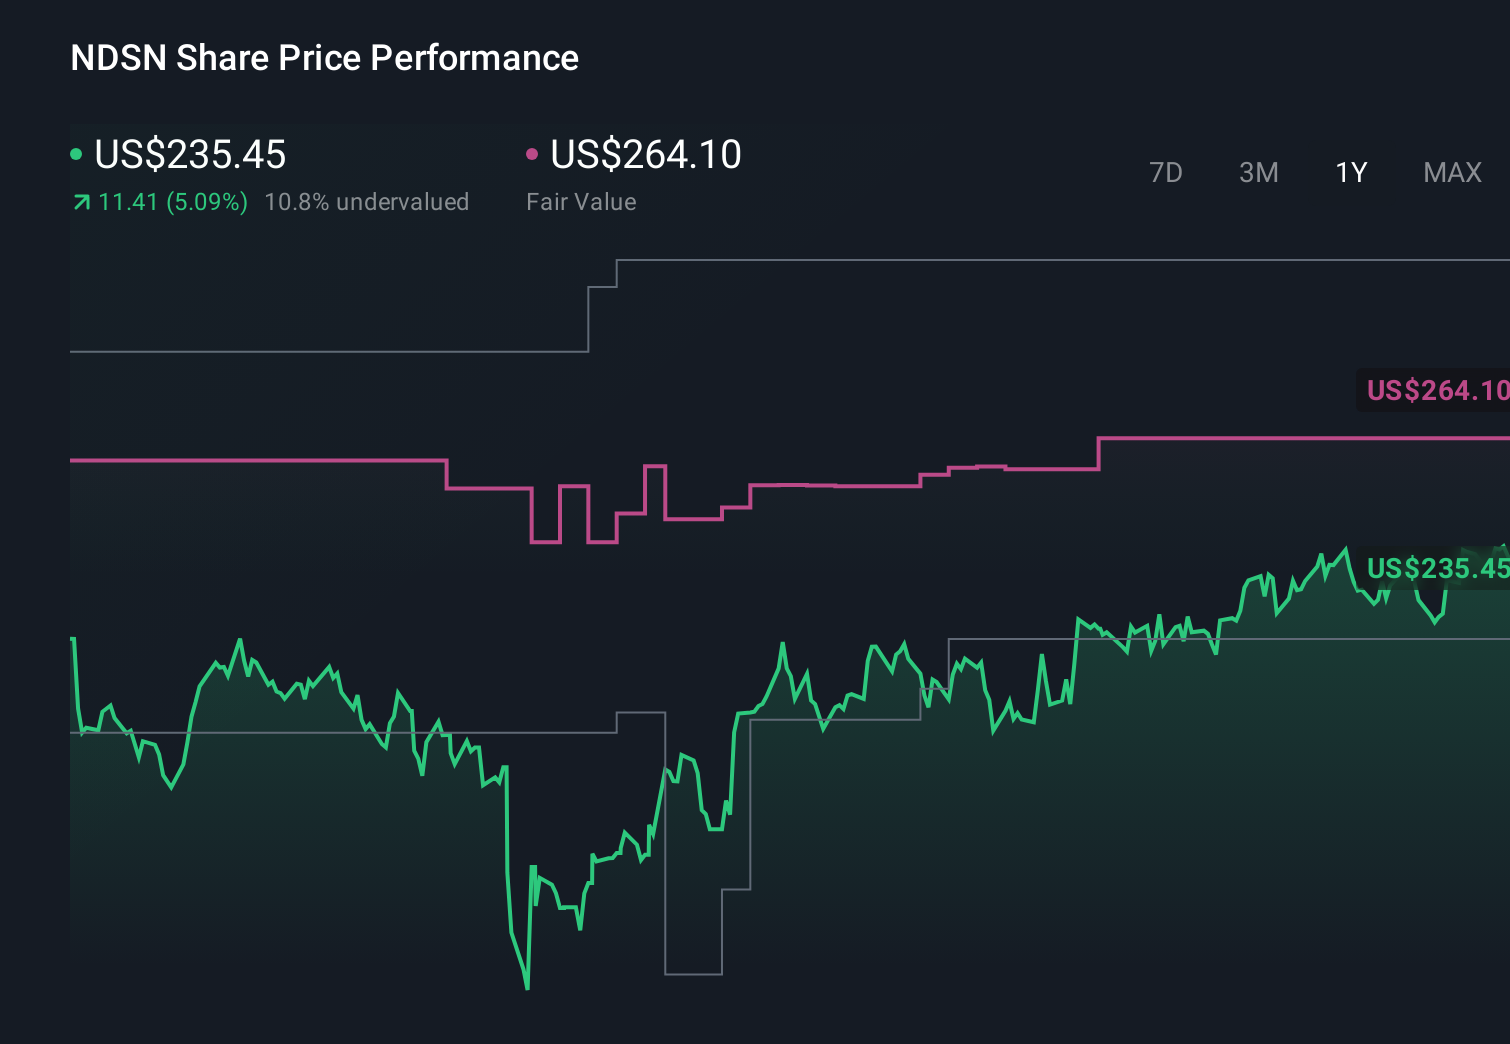
- The stock has drifted slightly lower in the short term, down 1.7% over the last week and 0.8% over the last month, but it is still up 14.4% year to date and 25.5% over five years. This hints at a longer term wealth compounder with some recent cooling.
- Recent coverage has focused on Nordson's steady role in niche manufacturing technologies and its ongoing investments to deepen its presence in high reliability dispensing and test applications. This reinforces the narrative of a durable, specialized industrial franchise. At the same time, commentary around industrials has highlighted how quality names like Nordson can command premium valuations when investors seek resilient cash flows rather than cyclical rebounds.
- Despite that quality story, Nordson currently scores just 0/6 on our valuation checks. This suggests it screens as fully priced or even expensive on most traditional metrics. Next we will unpack those valuation approaches, and later circle back to an even richer framework for thinking about what the market might be missing.
Nordson scores just 0/6 on our valuation checks. See what other red flags we found in the full valuation breakdown.
Approach 1: Nordson Discounted Cash Flow (DCF) Analysis
A Discounted Cash Flow model projects the cash Nordson is expected to generate in the future and then discounts those projections back to today to estimate what the business is worth in dollars right now.
Nordson generated about $665.1 million in free cash flow over the last twelve months, providing a solid base for the forecast. Analysts supply explicit estimates for the next few years, including roughly $667.0 million in 2026 and $688.8 million in 2027, and Simply Wall St then extrapolates these further, with projected free cash flow rising to about $884.4 million by 2035.
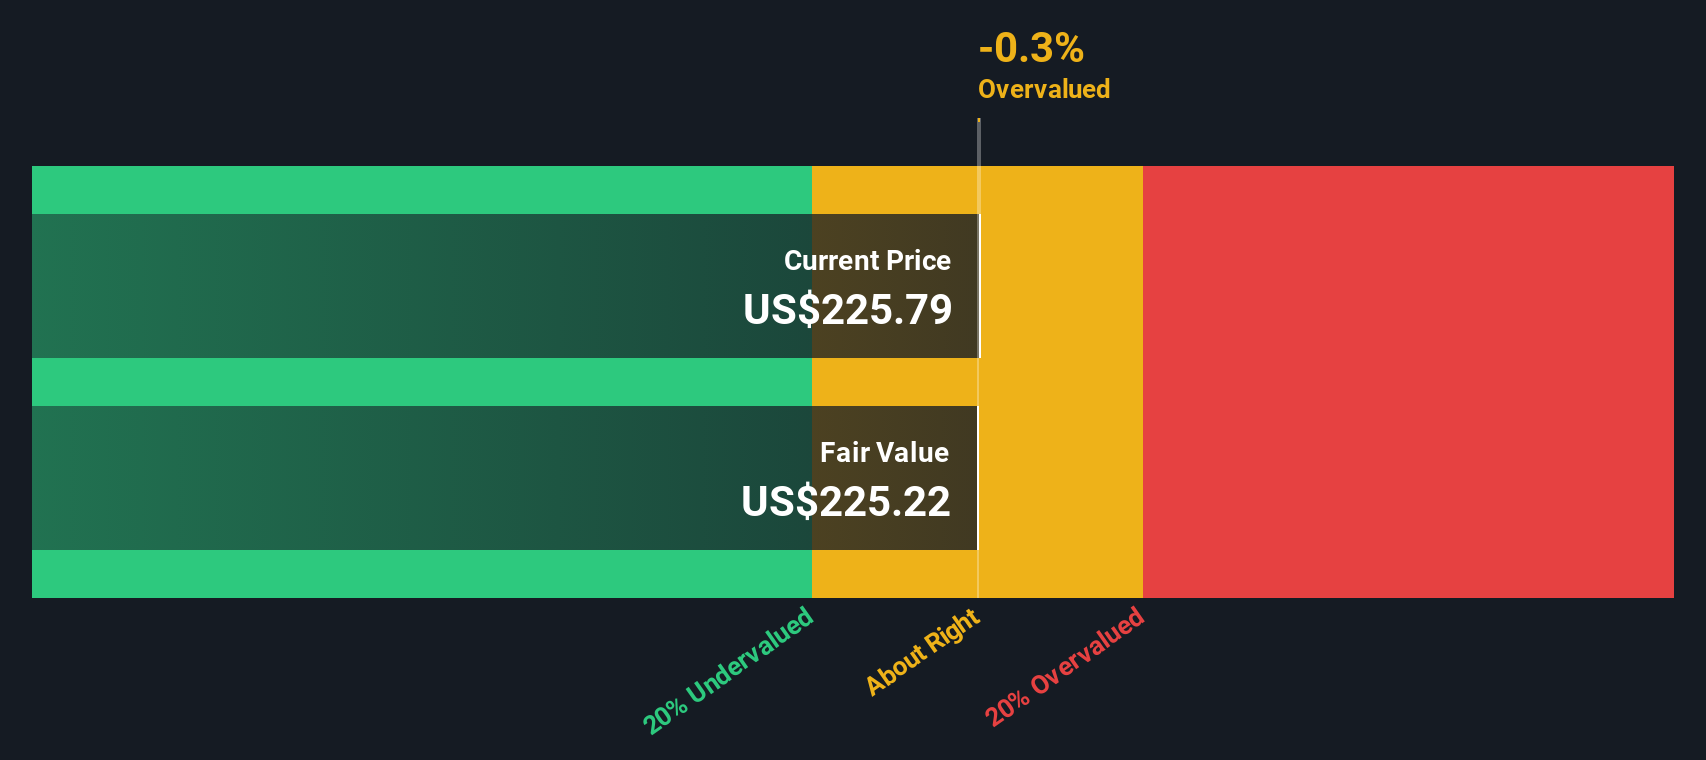
Using a 2 Stage Free Cash Flow to Equity model built on these projections, the estimated intrinsic value for Nordson comes out at about $217.71 per share. Compared with the current share price, this suggests the stock is roughly 7.7% overvalued, which represents a small premium for a high quality, cash generative industrial business.
Result: ABOUT RIGHT
Nordson is fairly valued according to our Discounted Cash Flow (DCF), but this can change at a moment's notice. Track the value in your watchlist or portfolio and be alerted on when to act.
Approach 2: Nordson Price vs Earnings
For a profitable, established business like Nordson, the price to earnings ratio is a useful way to gauge how much investors are willing to pay today for each dollar of current profits. It naturally reflects expectations for future growth and the level of risk, since faster growing or more resilient companies can justify a higher, or lower risk, multiple.
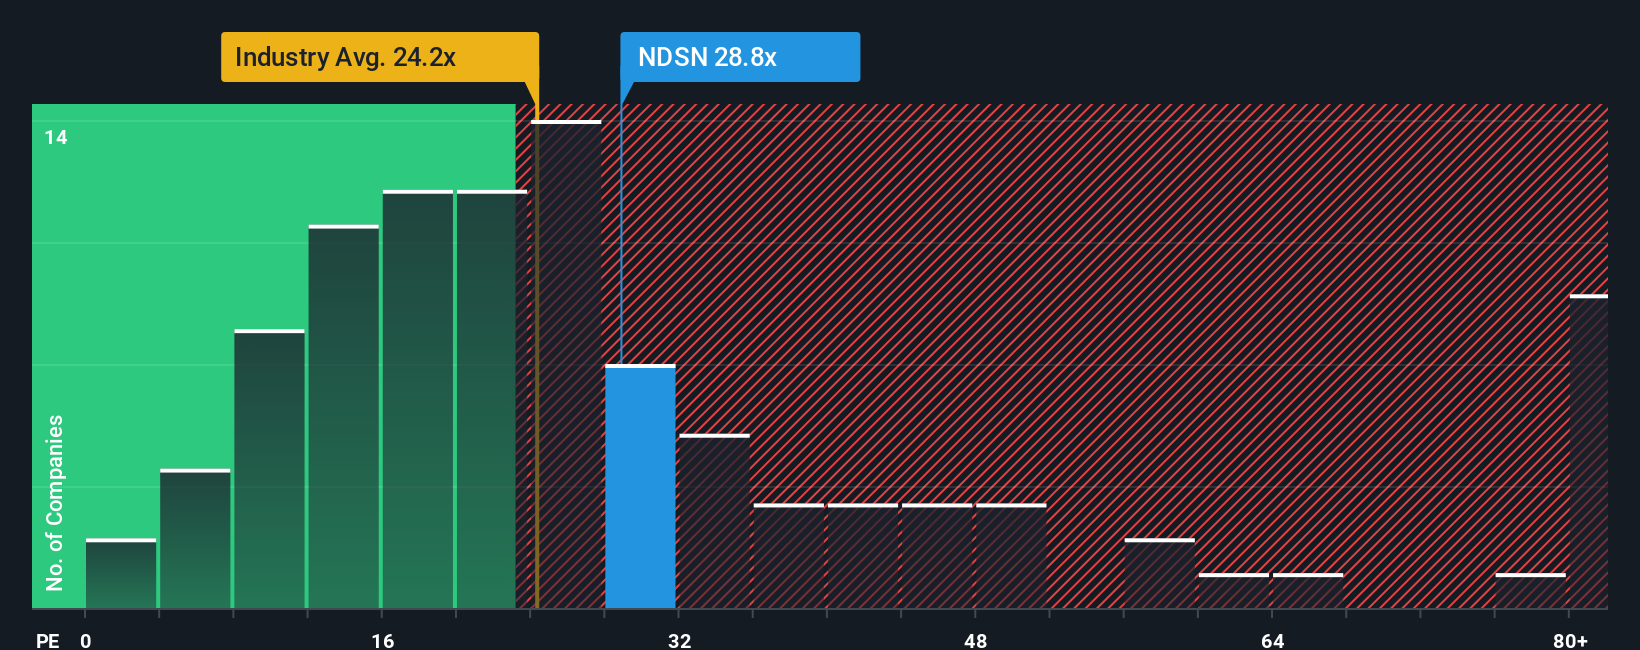
Nordson currently trades on a PE of about 27.19x. That sits modestly above both the broader Machinery industry average of around 26.02x and the peer group average of roughly 24.86x, signalling that the market already ascribes a quality premium to the stock. To refine this view, Simply Wall St calculates a Fair Ratio of 24.48x, a proprietary estimate of what Nordson’s PE should be once you factor in its specific earnings growth outlook, margins, industry positioning, size and risk profile.
This Fair Ratio provides a more tailored benchmark than simple peer or sector comparisons, because it adjusts for the nuances that make Nordson different from the typical Machinery name. With the current PE sitting above the Fair Ratio, the shares screen as somewhat expensive on this lens.
Result: OVERVALUED
PE ratios tell one story, but what if the real opportunity lies elsewhere? Discover 1447 companies where insiders are betting big on explosive growth.
Upgrade Your Decision Making: Choose your Nordson Narrative
Earlier we mentioned that there is an even better way to understand valuation, so let us introduce you to Narratives, a simple way to connect your view of Nordson’s story with a concrete forecast and a fair value. A Narrative is your own explanation behind the numbers, where you lay out how you think revenue, earnings and margins will evolve, and Simply Wall St turns that story into a full financial forecast and an estimated fair value. This makes Narratives a powerful but accessible tool on Simply Wall St’s Community page, used by millions of investors to compare their Fair Value with the current share price and decide whether Nordson looks like a buy, a hold, or a sell. Because Narratives are updated dynamically as new information such as earnings releases or news arrives, your fair value view stays current rather than static. For example, one Nordson Narrative might assume margins rise toward 20 percent and justify a fair value closer to about 285 dollars, while a more cautious Narrative might expect slower growth and point to something nearer 224 dollars. Both perspectives are visible and testable against today’s price.
Do you think there's more to the story for Nordson? Head over to our Community to see what others are saying!
This article by Simply Wall St is general in nature. We provide commentary based on historical data and analyst forecasts only using an unbiased methodology and our articles are not intended to be financial advice. It does not constitute a recommendation to buy or sell any stock, and does not take account of your objectives, or your financial situation. We aim to bring you long-term focused analysis driven by fundamental data. Note that our analysis may not factor in the latest price-sensitive company announcements or qualitative material. Simply Wall St has no position in any stocks mentioned.
Have feedback on this article? Concerned about the content? Get in touch with us directly. Alternatively, email editorial-team@simplywallst.com