
Is Lowe's Fairly Priced After Modest Gains and Mixed Valuation Signals in 2025?
- Wondering if Lowe's Companies at around $248 a share is a bargain or just fairly priced? Here is a closer look at what the numbers say about where value might be hiding.
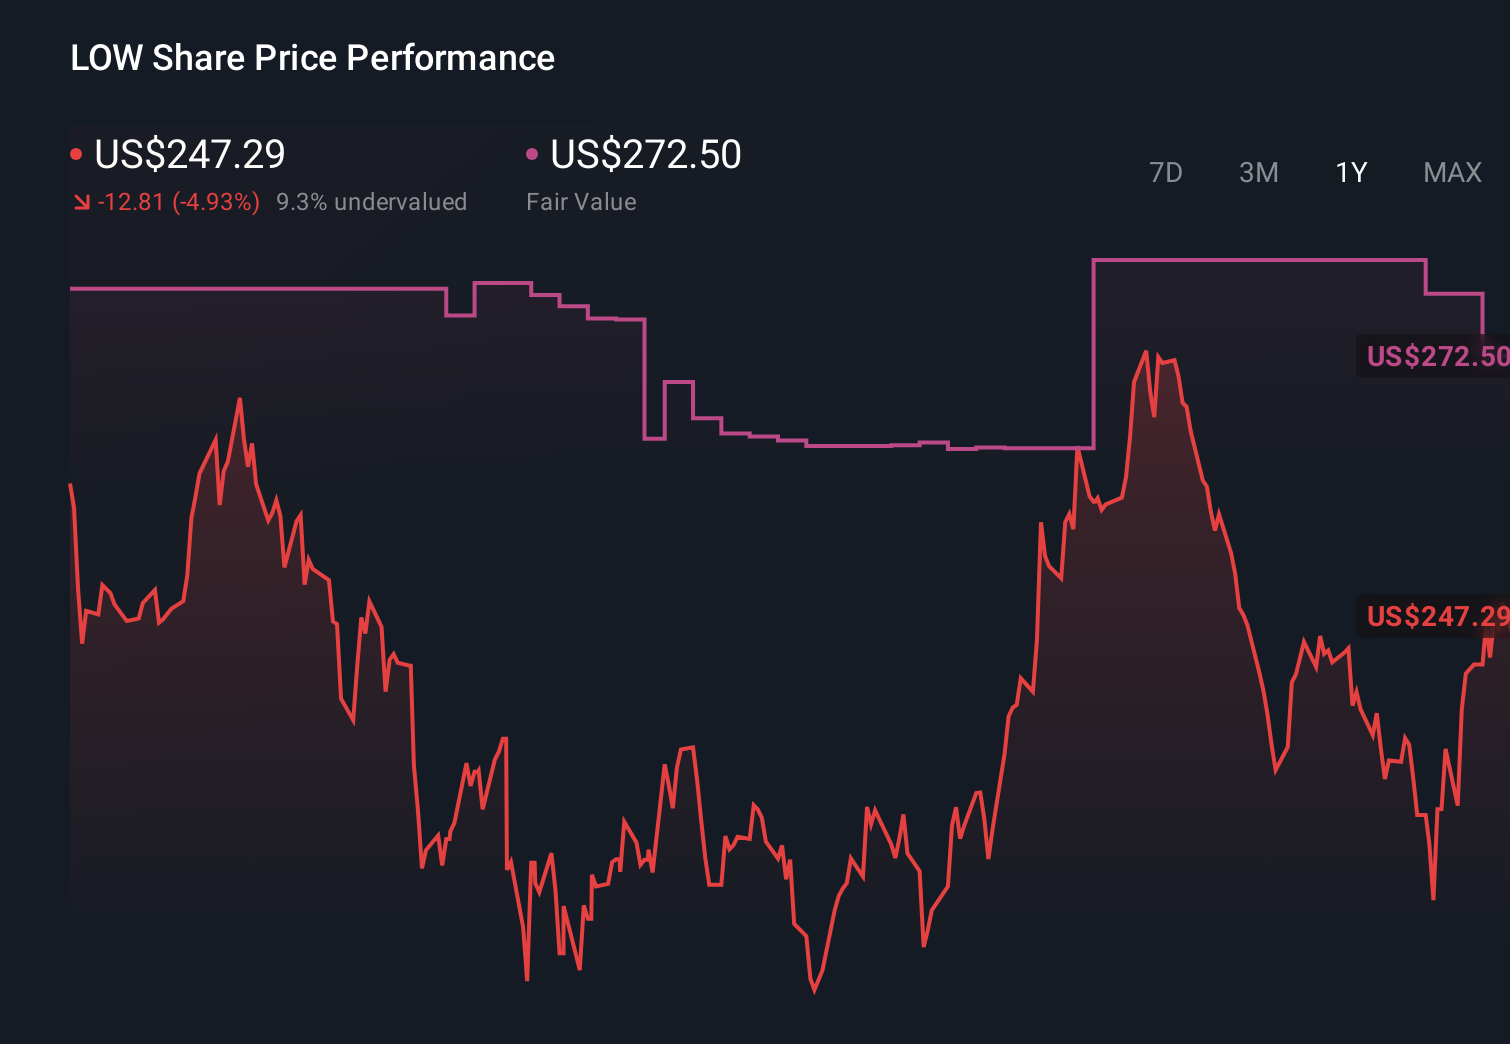
- The stock has inched up about 0.8% over the last week and 5.4% over the past month, but is roughly flat year to date and still about 4.0% lower than a year ago, even after gaining 26.6% over three years and 66.3% over five.
- Those moves come as investors continue to weigh the long term demand for home improvement against shifting consumer spending patterns and a cooling housing market. At the same time, Lowe's has been pushing strategic initiatives such as store refreshes, a focus on pro customers, and heavier use of data and digital tools. All of these factors influence how the market is rethinking its long term earnings power.
- On our framework Lowe's scores a 3/6 valuation check, suggesting it screens as undervalued in half of the key metrics we track. In the rest of this article we will break that down across different valuation approaches and finish with a more holistic way to judge whether the current price really matches the full story.
Find out why Lowe's Companies's -4.0% return over the last year is lagging behind its peers.
Approach 1: Lowe's Companies Discounted Cash Flow (DCF) Analysis
A Discounted Cash Flow model estimates what a company is worth by projecting the cash it can generate in the future and then discounting those dollars back into today’s terms. For Lowe's Companies, the model uses a 2 Stage Free Cash Flow to Equity approach built on cash flow projections.
Lowe's most recent twelve month free cash flow stands at about $7.2 billion. Analyst estimates and subsequent extrapolations see this rising to roughly $9.6 billion by 2030, with a structured path of growth over the next decade based on both explicit forecasts and Simply Wall St’s longer term assumptions.
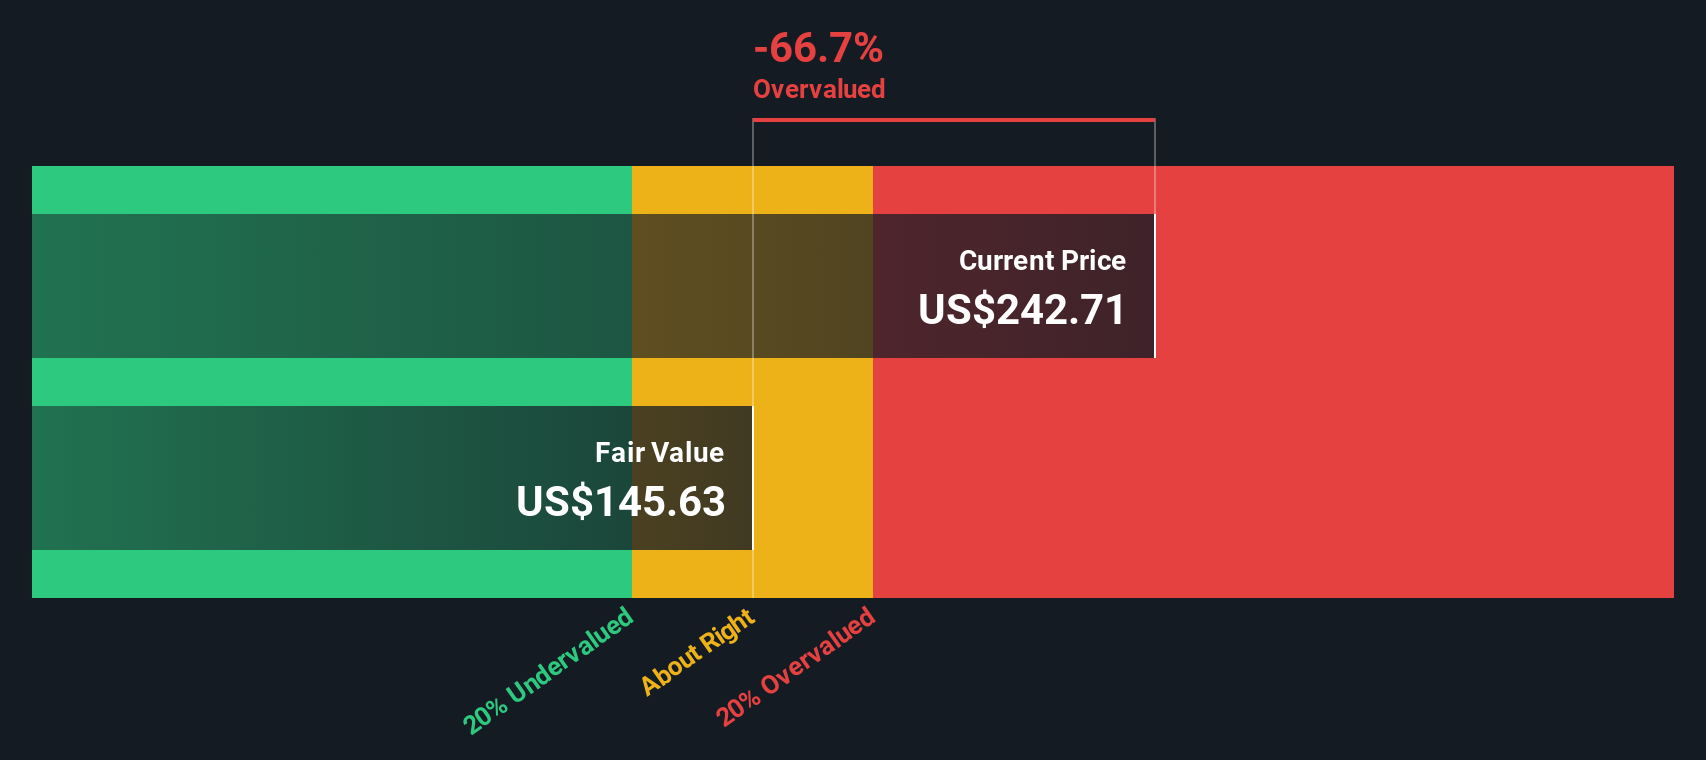
When these projected cash flows are discounted back to today, the DCF model arrives at an intrinsic value of about $262 per share. Compared with the current share price around $248, the model implies the stock is trading at roughly a 5.3% discount. This suggests the market is pricing in slightly weaker long term cash generation than the model assumes.
Result: ABOUT RIGHT
Lowe's Companies is fairly valued according to our Discounted Cash Flow (DCF), but this can change at a moment's notice. Track the value in your watchlist or portfolio and be alerted on when to act.
Approach 2: Lowe's Companies Price vs Earnings
For established, profitable companies like Lowe's, the price to earnings (PE) ratio is a useful way to gauge how much investors are willing to pay today for each dollar of current earnings. In general, faster growth and lower perceived risk justify a higher PE, while slower growth or higher uncertainty tend to keep a lid on what counts as a fair multiple.
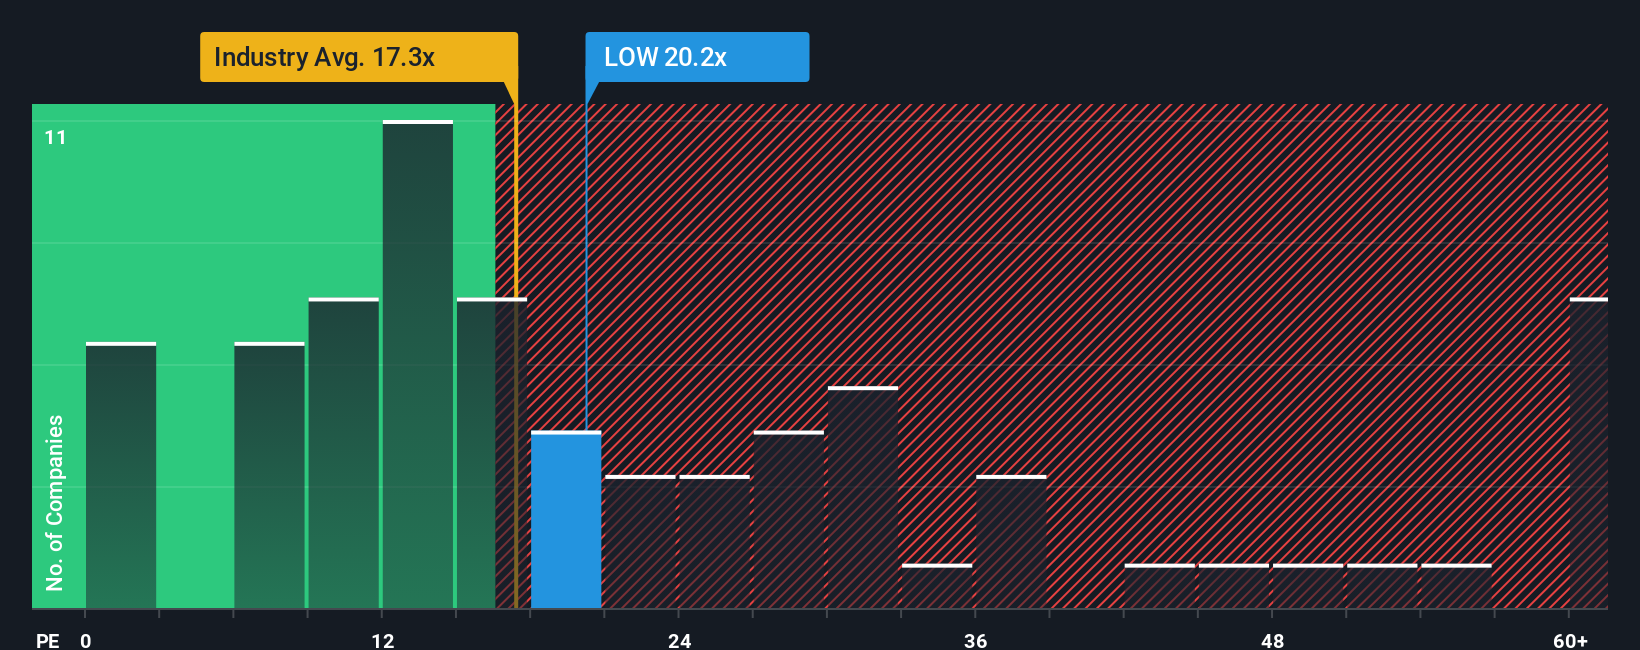
Lowe's currently trades on a PE of about 20.6x. That is slightly above the Specialty Retail industry average of roughly 20.2x, but well below the broader peer group average of around 30.3x, which includes some faster growing or more richly valued names. To cut through these blunt comparisons, Simply Wall St uses a proprietary Fair Ratio, which estimates what Lowe's PE should be once you factor in its earnings growth outlook, profit margins, industry, market cap and risk profile.
On that basis, Lowe's Fair Ratio is about 21.5x, marginally higher than where the stock trades today. Because the gap between the current multiple and the Fair Ratio is small, this points to the shares being roughly in line with their fundamental profile rather than a glaring bargain or an obvious bubble.
Result: ABOUT RIGHT
PE ratios tell one story, but what if the real opportunity lies elsewhere? Discover 1447 companies where insiders are betting big on explosive growth.
Upgrade Your Decision Making: Choose your Lowe's Companies Narrative
Earlier we mentioned that there is an even better way to understand valuation, so let us introduce you to Narratives, a simple way to attach your own story about Lowe's to the numbers by connecting how you think its revenue, earnings and margins will evolve to a financial forecast and then to a fair value estimate. On Simply Wall St, within the Community page used by millions of investors, you can choose or create a Narrative that matches your view, and the platform will automatically translate that story into a clear fair value that you can compare with the current share price to help you decide whether Lowe's looks like a buy, hold or sell. Narratives stay live and dynamic, updating as new information such as earnings releases, major acquisitions or industry news comes in, so your valuation automatically reflects the latest data. For example, some investors in Lowe's may build a bullish Narrative around accelerating Pro segment growth, improving margins and a fair value closer to the higher analyst targets. Others may focus on integration risk, slower housing turnover and margin pressure, leading to a more cautious Narrative and a fair value closer to the lower analyst estimates.
Do you think there's more to the story for Lowe's Companies? Head over to our Community to see what others are saying!
This article by Simply Wall St is general in nature. We provide commentary based on historical data and analyst forecasts only using an unbiased methodology and our articles are not intended to be financial advice. It does not constitute a recommendation to buy or sell any stock, and does not take account of your objectives, or your financial situation. We aim to bring you long-term focused analysis driven by fundamental data. Note that our analysis may not factor in the latest price-sensitive company announcements or qualitative material. Simply Wall St has no position in any stocks mentioned.
Have feedback on this article? Concerned about the content? Get in touch with us directly. Alternatively, email editorial-team@simplywallst.com