
Is FactSet Attractive After a 39% Slide and Mixed Valuation Signals in 2025?
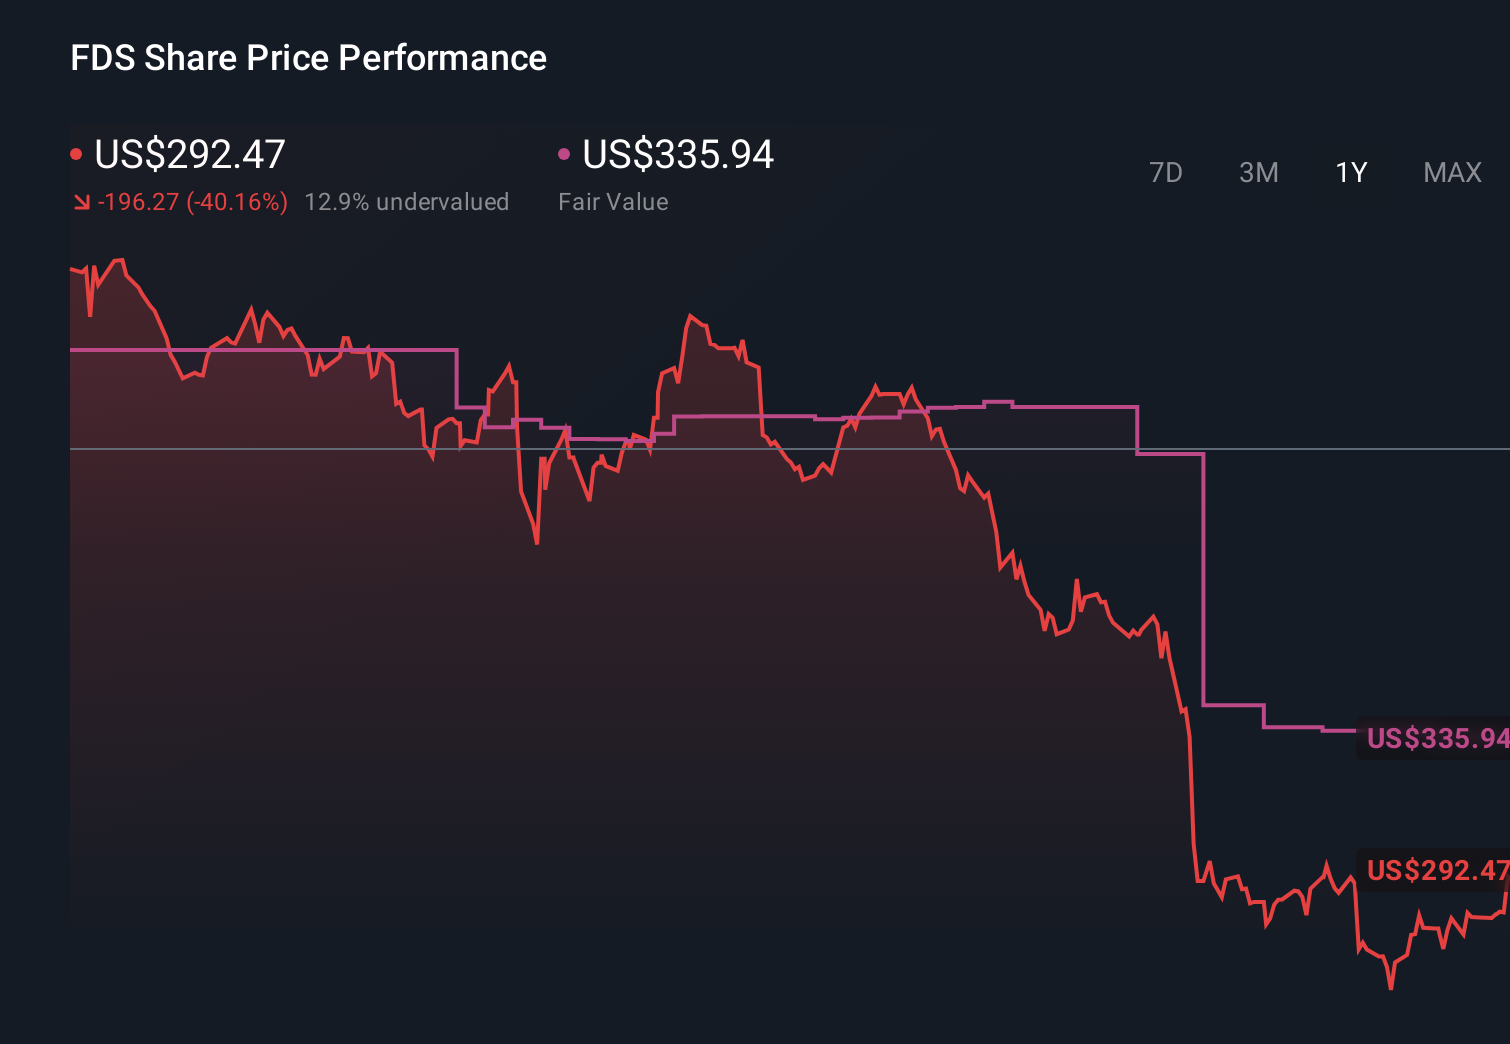
- Many investors are wondering if FactSet Research Systems is a bargain or a value trap at around $291 a share. With the recent slide in the share price, they are trying to figure out whether expectations have finally reset to a sensible level.
- Over the last week the stock is up 4.5%, adding to a 7.4% gain over the past month. However, this comes against a backdrop of a steep drawdown, with shares down 38.8% year to date and 39.6% over the last year.
- Investors have been digesting a mixed macro backdrop for financial data and analytics providers, including shifting spending priorities at asset managers and banks as they rethink budgets for research tools and data platforms. At the same time, FactSet continues to invest in AI enabled analytics, workflow tools for portfolio managers, and new data partnerships. This has helped support sentiment despite the longer term share price decline.
- On our valuation framework FactSet scores a 3 out of 6, suggesting some areas of undervaluation but not a clear-cut bargain. Below, we walk through what different valuation methods indicate and then finish with a more nuanced way to think about what the stock may really be worth.
Approach 1: FactSet Research Systems Excess Returns Analysis
The Excess Returns model asks whether FactSet Research Systems is generating returns on shareholder capital that are comfortably above its cost of equity, and how long that advantage can last. Instead of focusing on cash flows, it compares the earnings power created from each dollar of book value with the required return investors demand.
FactSet has a Book Value of $58.08 per share and a Stable EPS of $19.50 per share, based on the median return on equity from the past 5 years. With an Average Return on Equity of 28.17% versus a Cost of Equity of $5.89 per share, the model calculates an Excess Return of $13.61 per share. Analysts expect the Stable Book Value to rise to $69.23 per share, suggesting that reinvested earnings should continue to compound value.
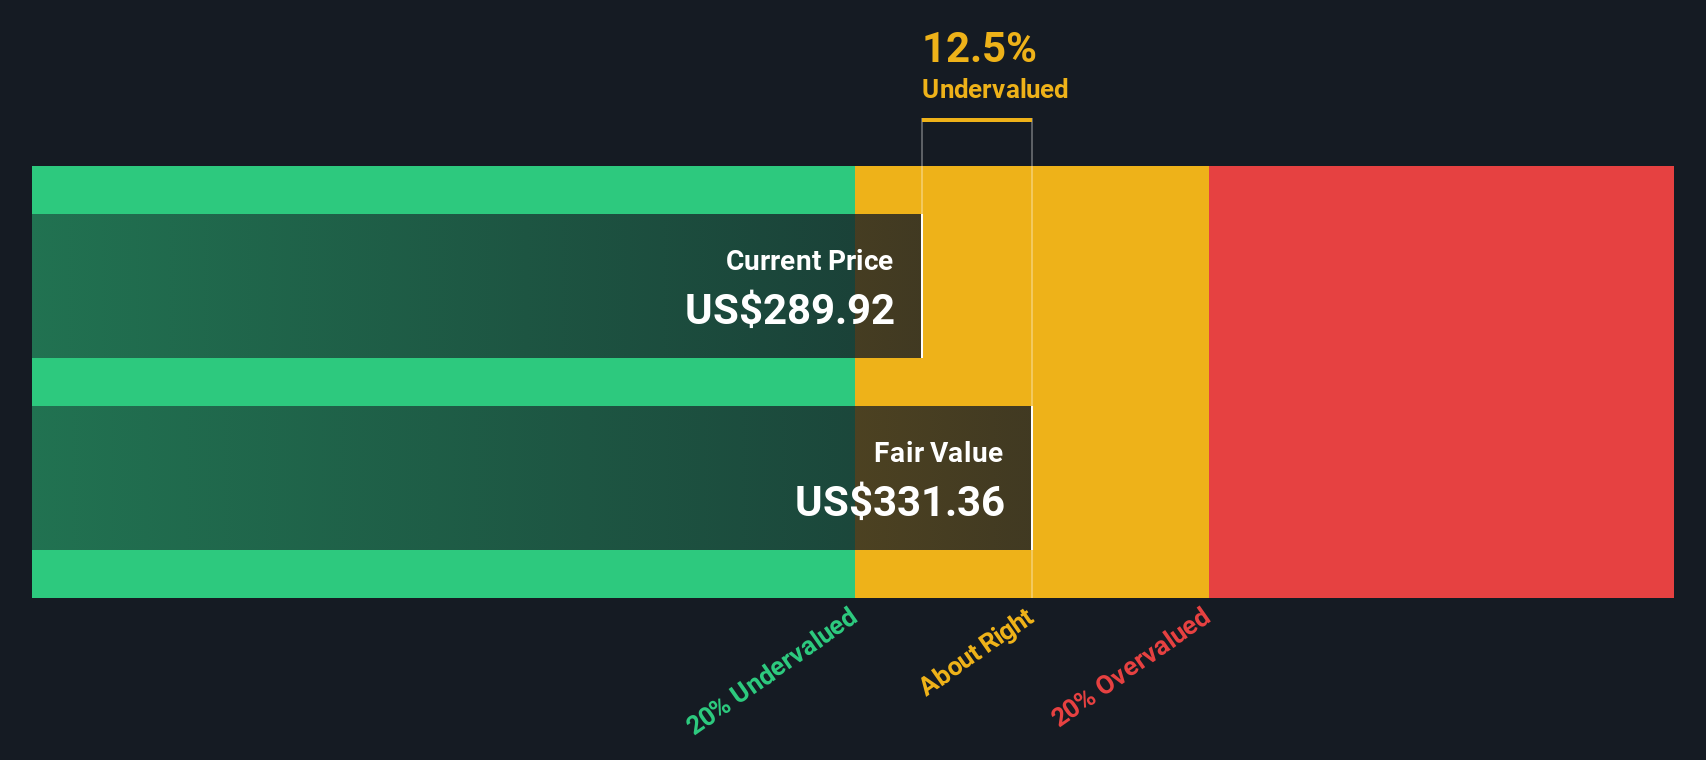
Bringing these excess returns together, the model estimates an intrinsic value of about $328.75 per share. This implies the stock is roughly 11.3% below fair value compared with the current price near $291, indicating a modest but meaningful margin of safety.
Result: UNDERVALUED
Our Excess Returns analysis suggests FactSet Research Systems is undervalued by 11.3%. Track this in your watchlist or portfolio, or discover 904 more undervalued stocks based on cash flows.
Approach 2: FactSet Research Systems Price vs Earnings
For a consistently profitable company like FactSet Research Systems, the price to earnings (PE) ratio is a useful way to gauge how much investors are willing to pay for each dollar of earnings. In general, companies with stronger growth prospects and more predictable earnings can justify a higher PE, while those with slower growth or higher risk typically trade on lower multiples.
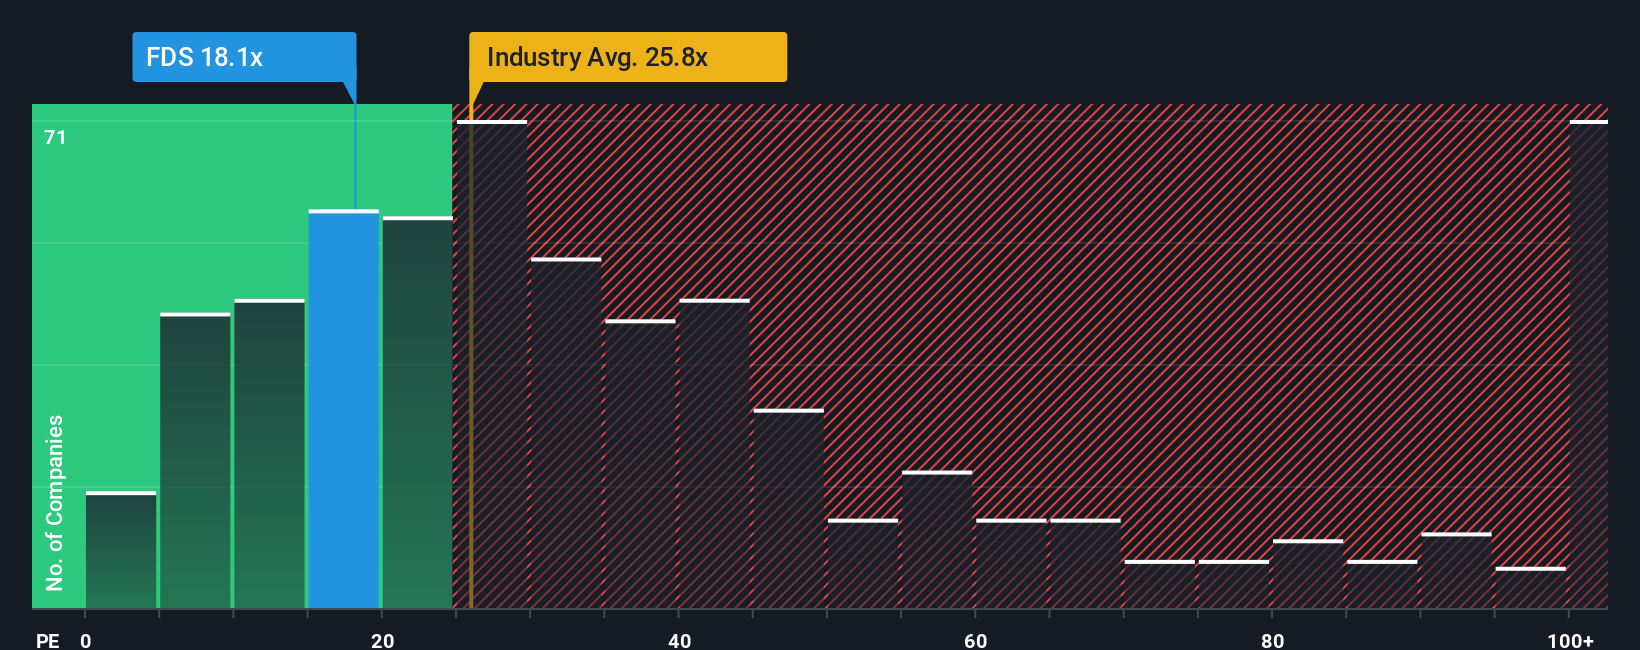
FactSet currently trades on a PE of about 18.27x. This sits well below the broader Capital Markets industry average of roughly 25.87x, and also below the peer group average of around 29.24x. To go a step further, Simply Wall St calculates a proprietary Fair Ratio of 14.16x, which reflects what a reasonable PE might be once factors such as the company’s specific earnings growth outlook, profitability, size, industry positioning and risk profile are taken into account.
This Fair Ratio is more informative than a simple comparison to peers or the industry, because it adjusts for the fact that not all Capital Markets businesses grow or earn at the same rate. Since FactSet’s actual PE of 18.27x is above the Fair Ratio of 14.16x, the stock screens as somewhat expensive on this metric.
Result: OVERVALUED
PE ratios tell one story, but what if the real opportunity lies elsewhere? Discover 1447 companies where insiders are betting big on explosive growth.
Upgrade Your Decision Making: Choose your FactSet Research Systems Narrative
Earlier we mentioned that there is an even better way to understand valuation, so let's introduce you to Narratives, a simple way to connect your view of FactSet Research Systems with a set of numbers such as future revenue, earnings, margins and a fair value estimate.
A Narrative is the story you believe about the company, written in financial terms, so it links what you think will drive FactSet's business, like AI products, client retention and margin trends, to a forecast and then to a fair value that you can directly compare to today's share price.
On Simply Wall St's Community page, Narratives are easy to create and explore. They are used by millions of investors, and they update dynamically when new information arrives, such as earnings results, analyst revisions or major news.
For example, one bullish FactSet Narrative might lean toward the upper end of analyst targets, closer to $500, assuming stronger AI driven growth and resilient margins. A more cautious Narrative might sit near $355, pricing in slower revenue progress and persistent cost pressures. By comparing each Narrative's Fair Value to the current share price you can decide whether it looks like a buy, hold or sell for your own portfolio.
Do you think there's more to the story for FactSet Research Systems? Head over to our Community to see what others are saying!
This article by Simply Wall St is general in nature. We provide commentary based on historical data and analyst forecasts only using an unbiased methodology and our articles are not intended to be financial advice. It does not constitute a recommendation to buy or sell any stock, and does not take account of your objectives, or your financial situation. We aim to bring you long-term focused analysis driven by fundamental data. Note that our analysis may not factor in the latest price-sensitive company announcements or qualitative material. Simply Wall St has no position in any stocks mentioned.
Have feedback on this article? Concerned about the content? Get in touch with us directly. Alternatively, email editorial-team@simplywallst.com