
Insperity (NSP): Reassessing Valuation After Its Strategic Workday Partnership and Potential Margin Rebuild
Insperity (NSP) just deepened its tech game by partnering with Workday, a move aimed at upgrading its HR platform, keeping existing clients stickier, and opening doors to larger mid market customers.
See our latest analysis for Insperity.
Despite the upbeat reaction to the Workday tie up, reflected in a 1 month share price return of 11.1 percent, Insperity is still digging out from a much deeper drawdown. Multi year total shareholder returns remain firmly negative, and momentum is only just starting to stabilise.
If you are reassessing your portfolio after Insperity's latest move, this could be a useful moment to explore fast growing stocks with high insider ownership for other compelling growth stories with skin in the game.
With the share price still nursing heavy multi year losses but trading at a near 18 percent discount to analysts’ targets, is Insperity a contrarian value play, or has the market already priced in any Workday driven recovery?
Most Popular Narrative Narrative: 15.5% Undervalued
With Insperity last closing at 38.02 dollars against a narrative fair value of 45.00 dollars, the valuation case leans toward a recovery story built on earnings.
Analysts are assuming Insperity's revenue will grow by 5.0% annually over the next 3 years. Analysts assume that profit margins will increase from 0.6% today to 1.4% in 3 years time.
Curious how modest revenue growth can still power a big earnings rebound and support a premium profit multiple usually reserved for market darlings? The narrative hinges on a sharp margin rebuild, a step change in profitability and a valuation reset that could catch skeptics off guard. Want to see the exact profit trajectory and valuation bridge behind that 45 dollar fair value?
Result: Fair Value of $45 (UNDERVALUED)
Have a read of the narrative in full and understand what's behind the forecasts.
However, surging healthcare costs or execution missteps on the Workday rollout could still easily derail that margin rebuild and valuation reset narrative.
Find out about the key risks to this Insperity narrative.
Another Lens On Valuation
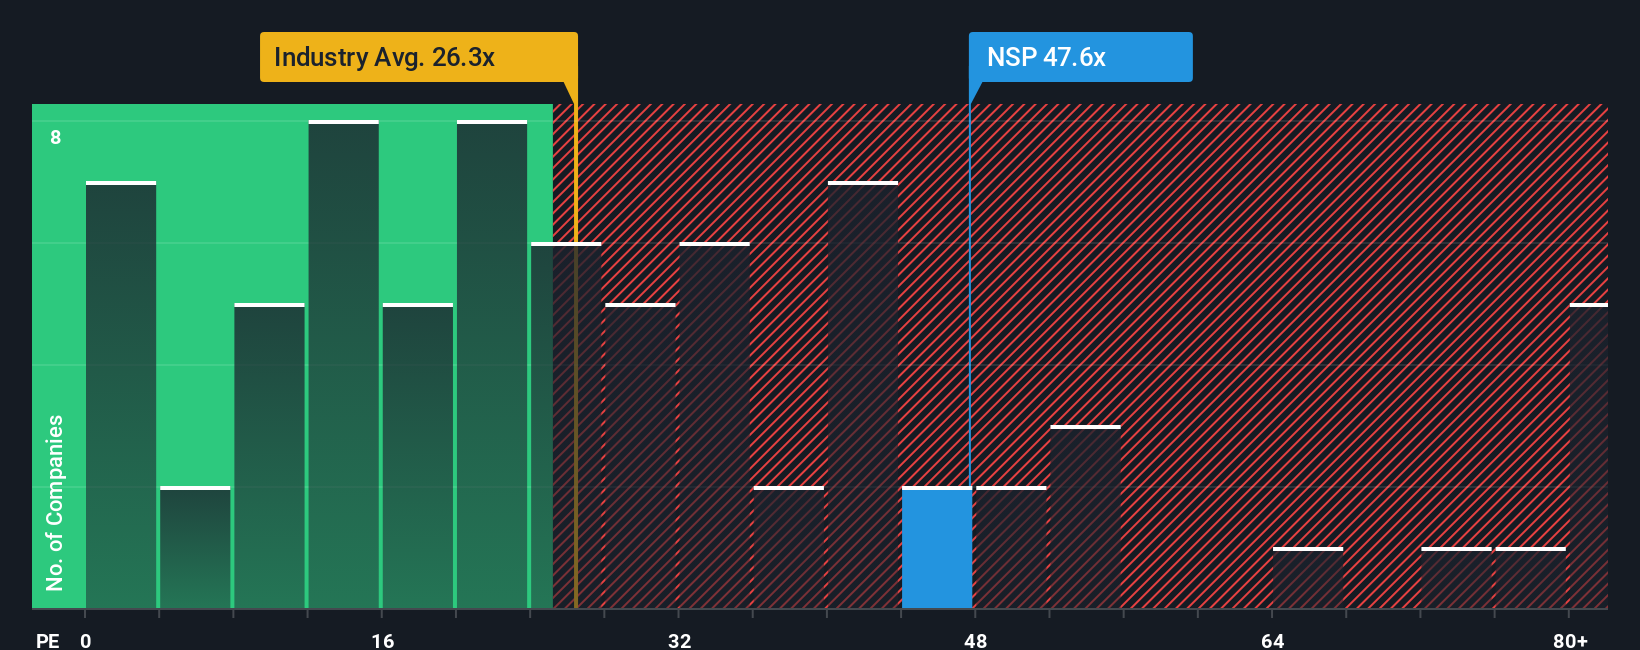
Step away from the narrative fair value and the story looks far more stretched. On a price to earnings basis, Insperity trades around 84 times versus 24.5 times for the Professional Services industry, 24.1 times for peers, and a fair ratio of 64.1 times, leaving little room for execution slip ups.
See what the numbers say about this price — find out in our valuation breakdown.
Build Your Own Insperity Narrative
If you see the numbers differently or would rather dive into the data yourself, you can craft a bespoke Insperity story in minutes: Do it your way.
A great starting point for your Insperity research is our analysis highlighting 2 key rewards and 3 important warning signs that could impact your investment decision.
Looking for more investment ideas?
Do not stop at Insperity when you can quickly scan fresh opportunities on Simply Wall Street’s Screener, tailored to the themes and strengths you care about most.
- Explore potential mispricings by reviewing these 903 undervalued stocks based on cash flows that may offer different characteristics than widely followed names.
- Focus on structural trends by targeting innovators across these 25 AI penny stocks before they become more broadly recognized.
- Fine-tune your income strategy by zeroing in on these 12 dividend stocks with yields > 3% that can complement returns in a range of market conditions.
This article by Simply Wall St is general in nature. We provide commentary based on historical data and analyst forecasts only using an unbiased methodology and our articles are not intended to be financial advice. It does not constitute a recommendation to buy or sell any stock, and does not take account of your objectives, or your financial situation. We aim to bring you long-term focused analysis driven by fundamental data. Note that our analysis may not factor in the latest price-sensitive company announcements or qualitative material. Simply Wall St has no position in any stocks mentioned.
Have feedback on this article? Concerned about the content? Get in touch with us directly. Alternatively, email editorial-team@simplywallst.com