
TerraVest Industries (TSX:TVK) EPS Surge Reinforces Bullish Growth Narratives Despite Margin Compression
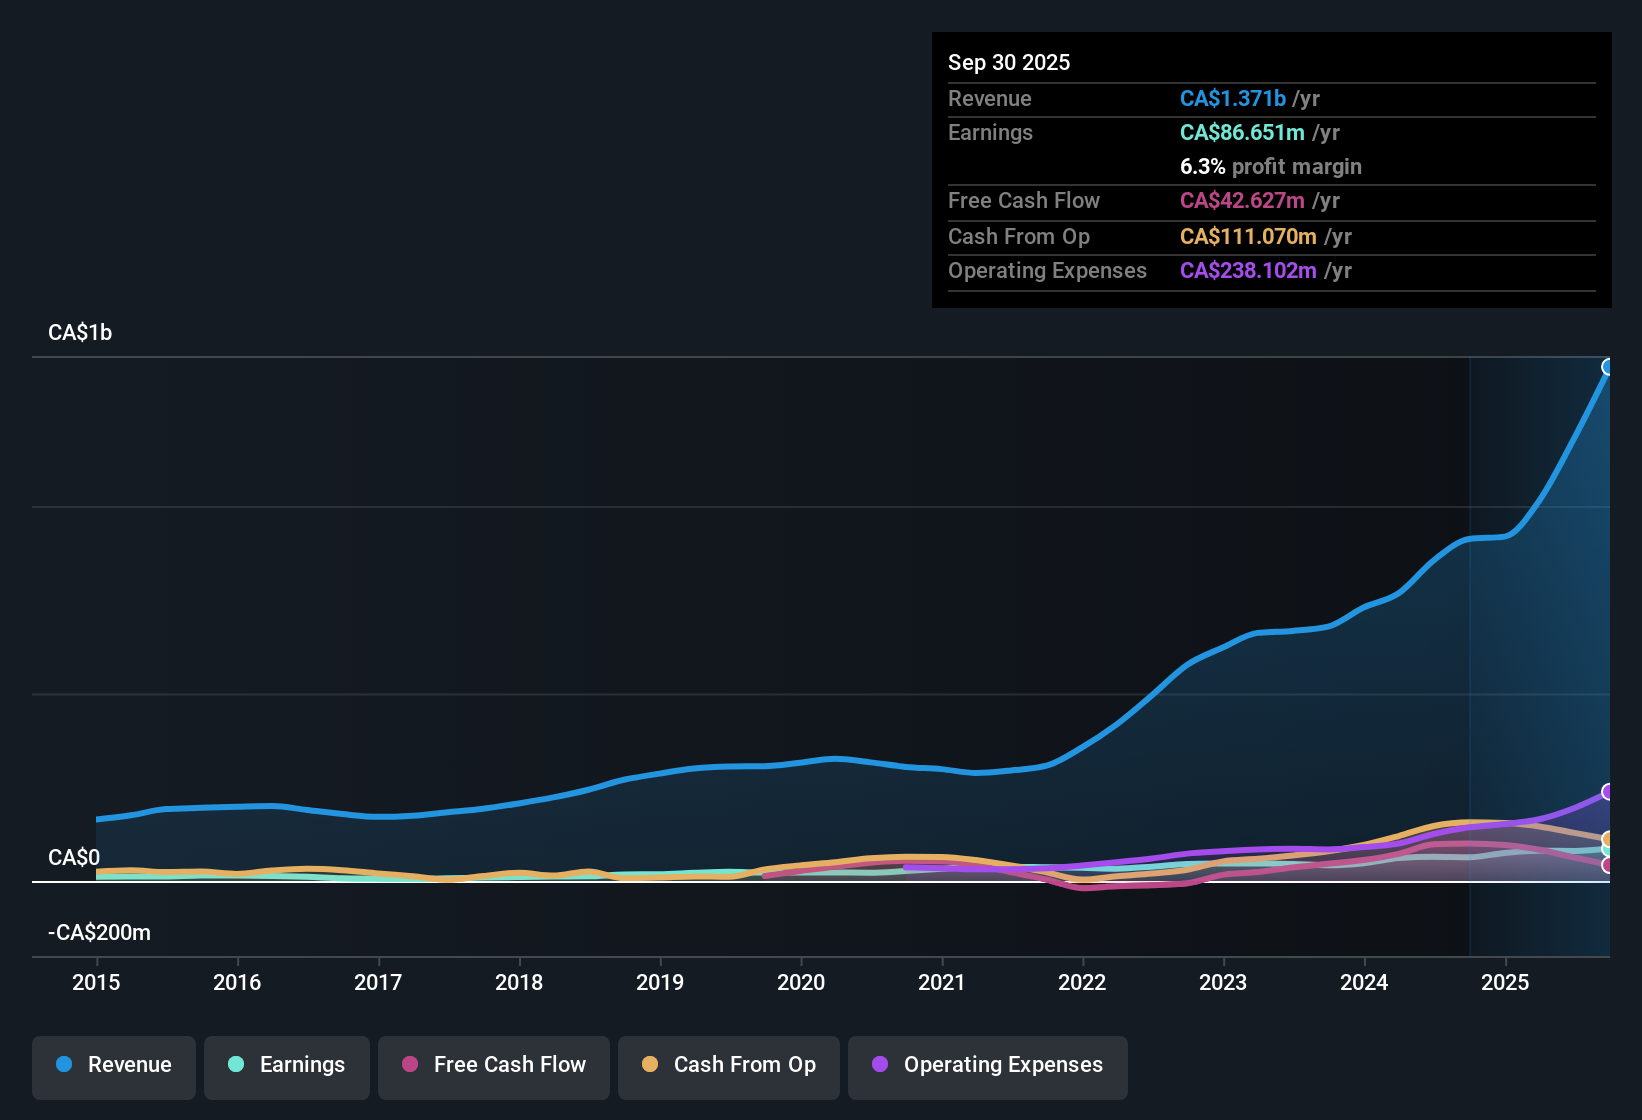
TerraVest Industries (TSX:TVK) just wrapped up FY 2025 with fourth quarter revenue of CA$419.4 million and EPS of CA$0.85, capping a twelve month run that delivered EPS of CA$4.27 on CA$1.37 billion of revenue alongside 36.3% year over year earnings growth. The company has seen revenue move from CA$911.8 million in the twelve months to Q4 2024 to CA$1.37 billion over the latest twelve months, while trailing EPS climbed from CA$3.41 to CA$4.27, leaving investors to weigh that earnings momentum against slightly softer margins over the year.
See our full analysis for TerraVest Industries.With the headline numbers on the table, the next step is to see how this mix of higher earnings and tighter margins lines up with the dominant narratives investors have been trading on.
Curious how numbers become stories that shape markets? Explore Community Narratives
36.3% Earnings Growth Meets 6.3% Margin
- Over the last 12 months, net income reached CA$86.7 million on CA$1.37 billion of revenue, yielding a 6.3% net margin compared with 7.0% a year earlier, while earnings still grew 36.3% year over year.
- What stands out for a bullish view is that strong earnings growth and forecasts of roughly 19% annual earnings and revenue growth coexist with thinner margins, which means:
- Supporters can point to the 21.2% five-year average earnings growth and the 36.3% latest year jump as evidence that scale has outweighed margin pressure so far.
- Cautious investors may focus on the move from a 7.0% to 6.3% net margin and ask how sustainable those growth rates are if pricing or costs stay tight.
Rich 38.4x P/E Versus Peers
- The shares trade on a trailing P/E of 38.4 times compared with about 14 times for peers and 16.5 times for the wider North American Energy Services industry, putting TerraVest on a notably richer multiple than its immediate sector reference points.
- From a bearish standpoint, critics highlight that this premium multiple sits alongside compressed margins and interest coverage risk, creating a valuation setup where:
- The 6.3% net margin and weaker interest coverage mean there is less room for error than the 38.4 times P/E might suggest if growth were to slow from the roughly 19% per year that is currently forecast.
- The fact that peers trade closer to 14 times earnings and the broader industry near 16.5 times gives skeptics concrete benchmarks when arguing the stock is expensive on simple multiples.
DCF Fair Value Signals Big Upside
- Against the current share price of CA$153.39, the DCF fair value of CA$294.61 and an analyst price target of CA$184.83 both imply upside, with the DCF figure suggesting particularly large potential value if growth plays out as expected.
- Supporters of a bullish narrative argue that this gap between price and estimated value is backed up by the growth profile, and the data provides some fuel for that case:
- The combination of 36.3% year over year earnings growth and forecast revenue and earnings growth of about 19% annually is consistent with models that arrive at a DCF fair value well above today’s CA$153.39 share price.
- At the same time, the 6.3% net margin and noted weakness in interest coverage show why the market might still be cautious, leaving room for upside only if those growth and funding assumptions hold.
Next Steps
Don't just look at this quarter; the real story is in the long-term trend. We've done an in-depth analysis on TerraVest Industries's growth and its valuation to see if today's price is a bargain. Add the company to your watchlist or portfolio now so you don't miss the next big move.
See What Else Is Out There
TerraVest’s premium valuation, thinner 6.3% margins, and weaker interest coverage mean there is less room for error if its ambitious growth stumbles.
If stretched valuations and fragile cushions make you uneasy, use our solid balance sheet and fundamentals stocks screener (1944 results) today to quickly zero in on financially stronger companies built to better withstand setbacks.
This article by Simply Wall St is general in nature. We provide commentary based on historical data and analyst forecasts only using an unbiased methodology and our articles are not intended to be financial advice. It does not constitute a recommendation to buy or sell any stock, and does not take account of your objectives, or your financial situation. We aim to bring you long-term focused analysis driven by fundamental data. Note that our analysis may not factor in the latest price-sensitive company announcements or qualitative material. Simply Wall St has no position in any stocks mentioned.
Have feedback on this article? Concerned about the content? Get in touch with us directly. Alternatively, email editorial-team@simplywallst.com