
Is It Too Late to Consider Airbnb After Recent Share Price Rebound?
- Wondering if Airbnb at around $128 a share is still a good deal or if the easy money has already been made? This article breaks down what the current price really implies about its future.
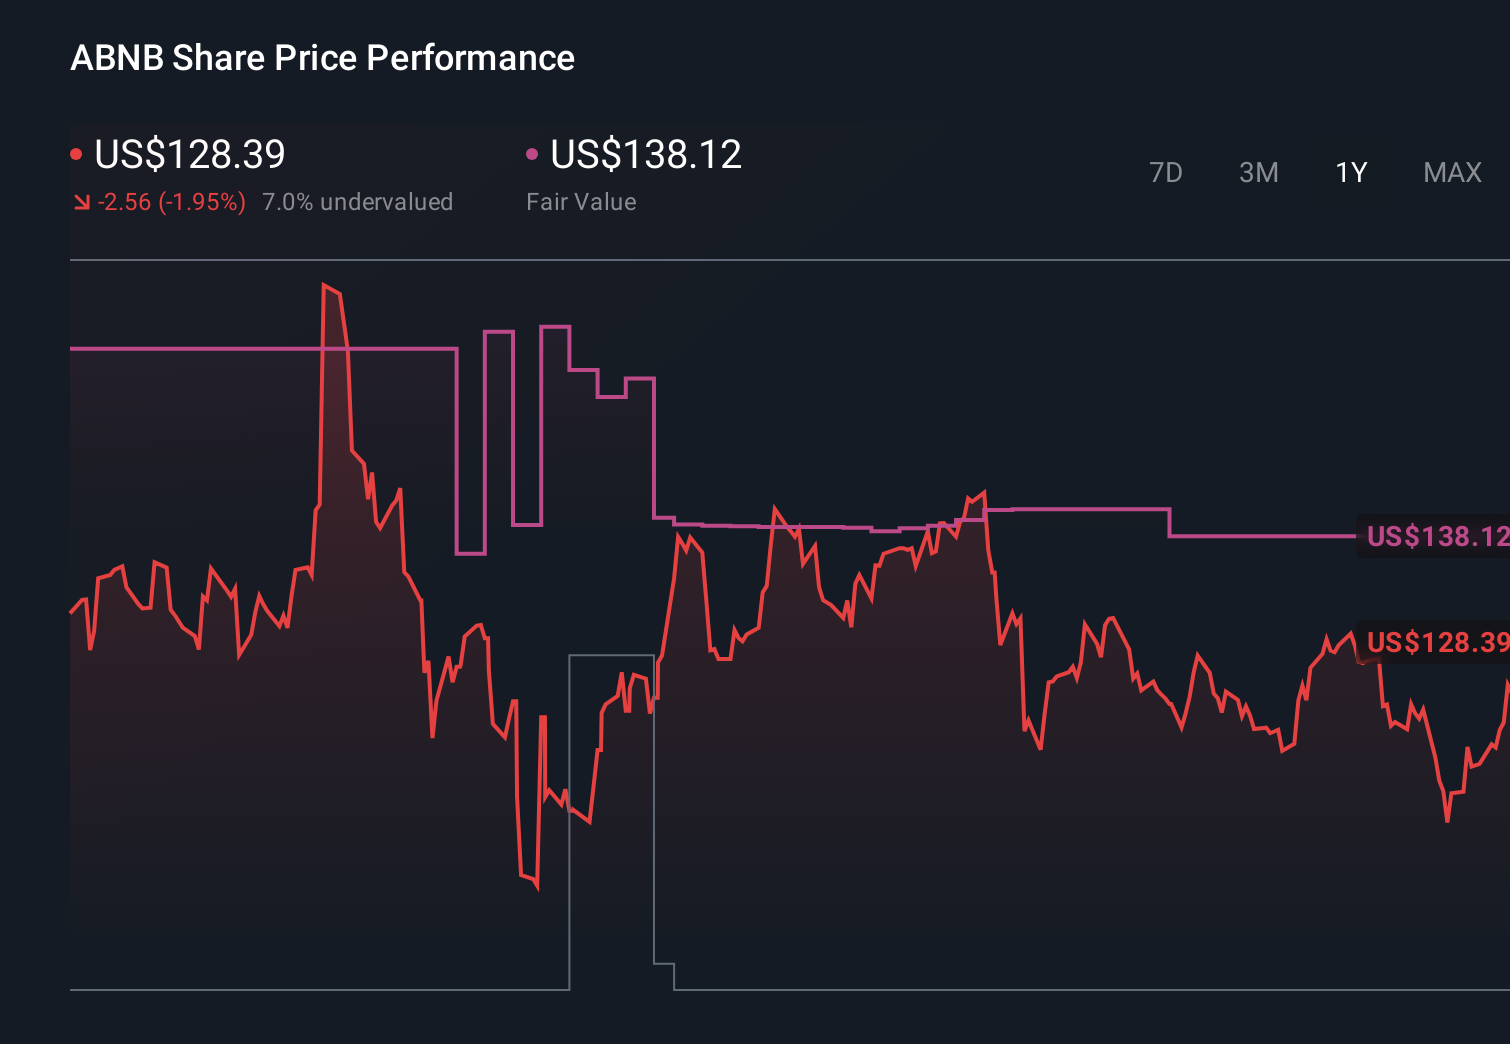
- Despite being down about 2.4% year to date and 2.0% over the last year, the stock has quietly climbed 3.3% in the past week and 5.5% over the last month, hinting that investor sentiment may be starting to turn.
- That recent strength has come as investors refocus on travel demand normalizing, ongoing product improvements on the platform, and a broader debate about how regulations will shape Airbnb’s long term growth runway. At the same time, shifting views on interest rates and risk appetite across tech and consumer stocks have added extra volatility around what investors are willing to pay for “asset light” platforms like Airbnb.
- Right now, Airbnb scores a 4/6 valuation check. This suggests it screens as undervalued on most, but not all, of our standard metrics. We will unpack those methods next, before finishing with a more intuitive way to think about what the market is really pricing in.
Find out why Airbnb's -2.0% return over the last year is lagging behind its peers.
Approach 1: Airbnb Discounted Cash Flow (DCF) Analysis
A Discounted Cash Flow model estimates what a company is worth by projecting the cash it can generate in the future and discounting those cash flows back to today in $ terms.
For Airbnb, the model uses a 2 stage Free Cash Flow to Equity approach. The latest twelve months Free Cash Flow is about $4.6 billion, and analysts expect this to keep growing as the platform scales. For example, projected Free Cash Flow for 2029 is about $7.2 billion, with further analyst and extrapolated estimates taking it above $10 billion by 2035 as growth gradually slows.
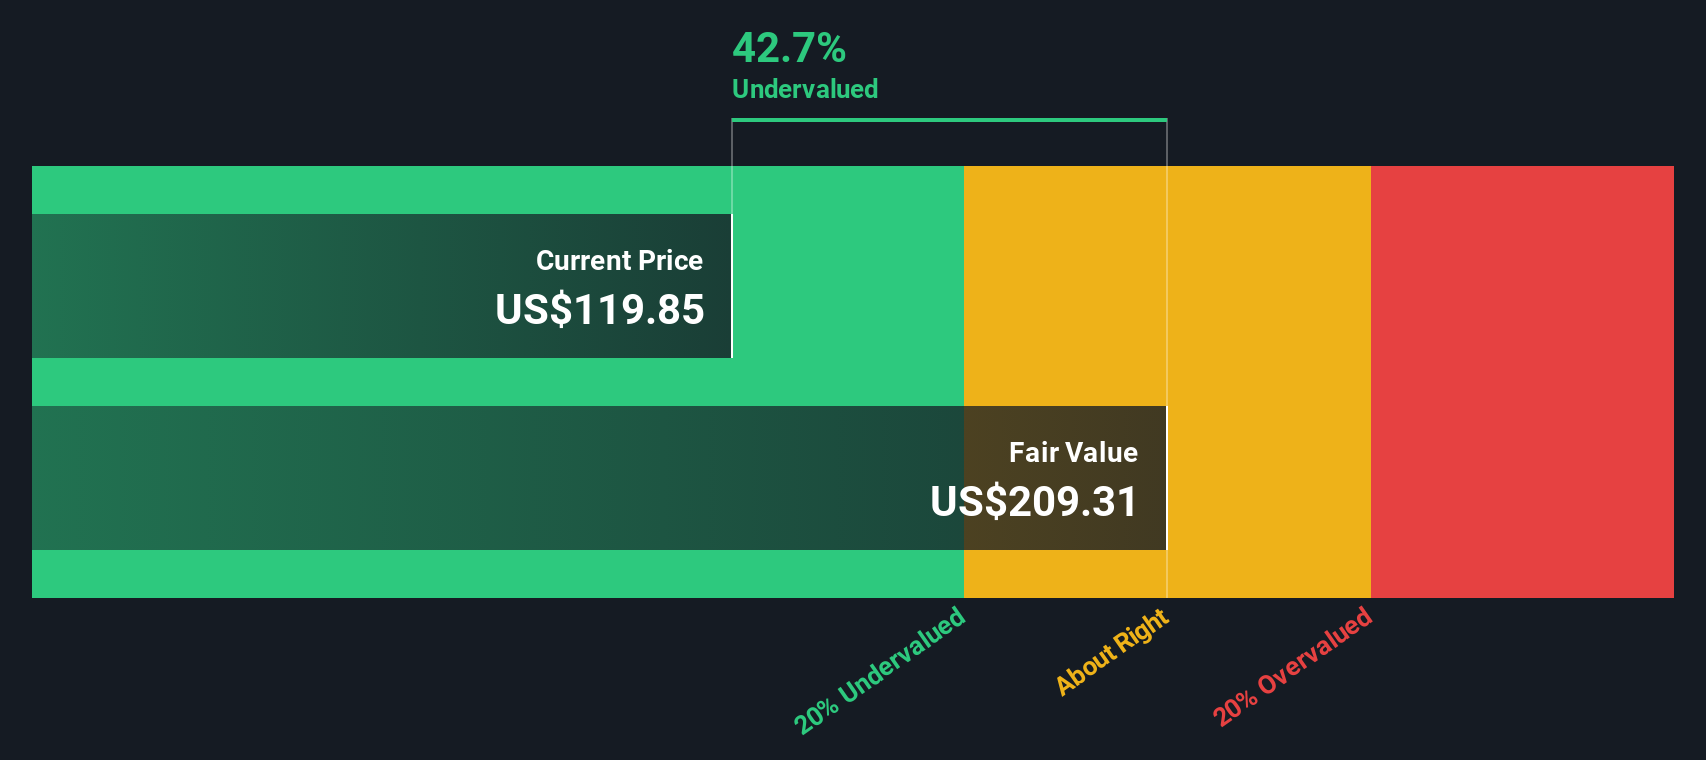
When all these future cash flows are discounted back to today, Simply Wall St estimates an intrinsic value of roughly $232.49 per share. Compared with a recent market price around $128, the DCF suggests the stock is about 44.8% undervalued, which indicates that investors are still pricing in a much more cautious long term trajectory than the cash flow model.
Result: UNDERVALUED
Our Discounted Cash Flow (DCF) analysis suggests Airbnb is undervalued by 44.8%. Track this in your watchlist or portfolio, or discover 907 more undervalued stocks based on cash flows.
Approach 2: Airbnb Price vs Earnings
For profitable companies like Airbnb, the Price to Earnings ratio is a useful shorthand for how much investors are willing to pay today for each dollar of current earnings. It naturally ties valuation to profitability, which is ultimately what should support a company’s long term value.
What counts as a “normal” or “fair” PE depends on how fast earnings are expected to grow and how risky those earnings are. Higher growth and more resilient profits usually justify a higher multiple, while slower or more uncertain growth calls for a lower one.
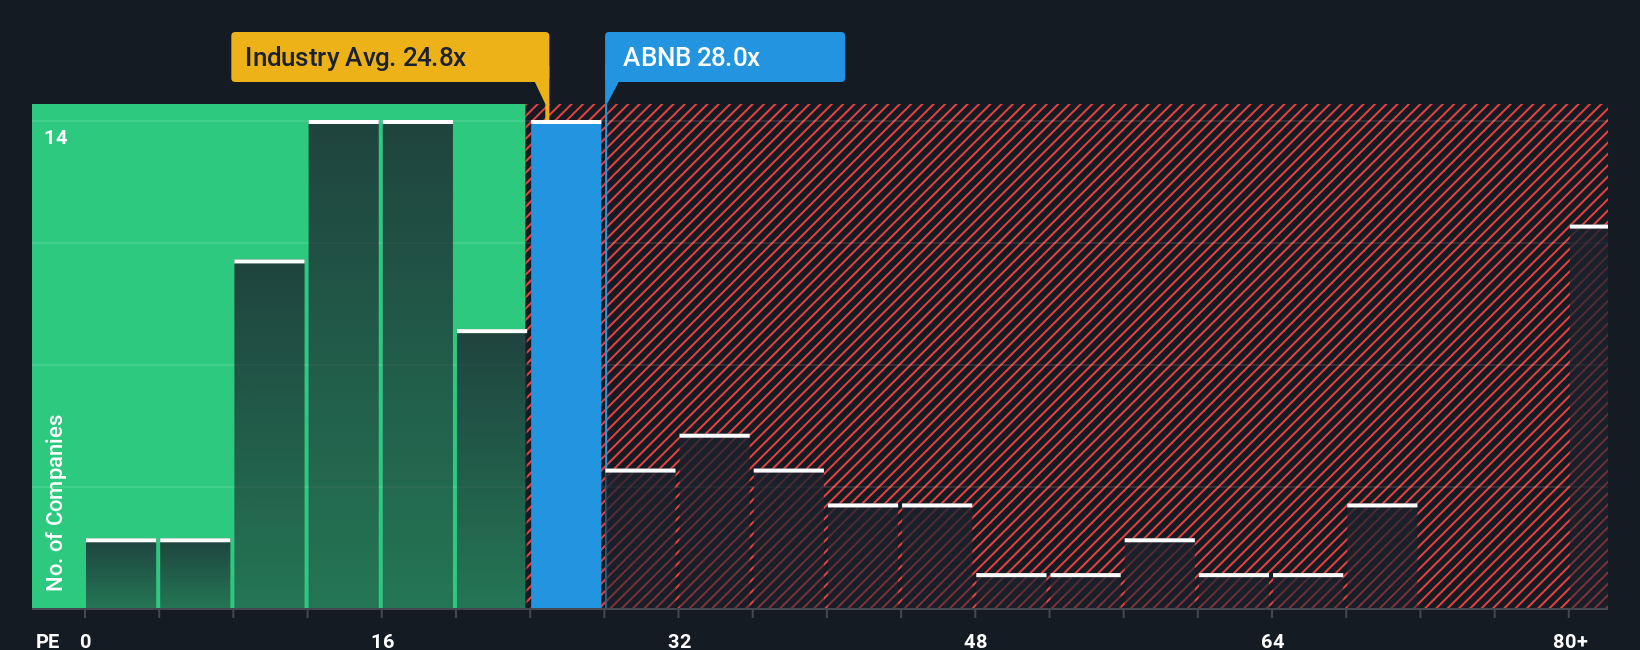
Airbnb currently trades on about 29.6x earnings, slightly below both its Hospitality industry average of roughly 24.6x and its direct peer group at around 30.6x. Simply Wall St also calculates a proprietary Fair Ratio for Airbnb of about 30.4x, which is the PE you might expect given its earnings growth profile, margins, industry, market cap and risk factors. This is more informative than a simple peer or industry comparison because it adjusts for Airbnb’s specific strengths and risks rather than assuming all companies deserve the same multiple. With the actual PE only modestly below the Fair Ratio, the stock screens as slightly undervalued on this metric.
Result: UNDERVALUED
PE ratios tell one story, but what if the real opportunity lies elsewhere? Discover 1448 companies where insiders are betting big on explosive growth.
Upgrade Your Decision Making: Choose your Airbnb Narrative
Earlier we mentioned that there is an even better way to understand valuation, so let us introduce you to Narratives.
A Narrative is simply your story about a company, written in numbers as well as words, where you connect what you believe about its business, competition and industry to assumptions about future revenue, earnings and margins, and then to a fair value per share.
On Simply Wall St, Narratives sit inside the Community page and turn this story into a clear financial forecast and fair value estimate. You can then easily compare this with today’s share price to decide whether Airbnb looks like a buy, a hold or a sell for you.
Because they are hosted on the platform used by millions of investors, Narratives are updated dynamically as new information such as earnings releases, regulatory news or product launches comes in. This means your fair value view does not stay static while the world changes.
For example, one Airbnb Narrative on Simply Wall St currently sees fair value near $98 while another is up at about $181. This reflects how two investors looking at the same facts can reasonably reach very different, but clearly quantified, conclusions about what the stock is worth today.
Do you think there's more to the story for Airbnb? Head over to our Community to see what others are saying!
This article by Simply Wall St is general in nature. We provide commentary based on historical data and analyst forecasts only using an unbiased methodology and our articles are not intended to be financial advice. It does not constitute a recommendation to buy or sell any stock, and does not take account of your objectives, or your financial situation. We aim to bring you long-term focused analysis driven by fundamental data. Note that our analysis may not factor in the latest price-sensitive company announcements or qualitative material. Simply Wall St has no position in any stocks mentioned.
Have feedback on this article? Concerned about the content? Get in touch with us directly. Alternatively, email editorial-team@simplywallst.com