
Does Palo Alto Networks Recent Pullback Present a Compelling Valuation Opportunity in 2025?
- If you have been wondering whether Palo Alto Networks is still worth buying after its strong run over the last few years, this breakdown will walk through whether the current price still makes sense.
- Despite a solid long term gain of 153.9% over 3 years and 223.5% over 5 years, the stock has cooled recently, with the share price down 3.6% over the past week, 8.7% over the last month, and slipping 2.5% over the past year, even though it is still up 6.1% year to date.
- Recent moves have been shaped by ongoing optimism around cybersecurity spending and Palo Alto Networks push into next generation security platforms, as enterprises consolidate vendors and shift more security to the cloud. At the same time, a more cautious market tone toward high growth tech and changing expectations around interest rates have made investors more sensitive to how much they are paying for that growth.
- Right now, Palo Alto Networks scores just 1 out of 6 on our valuation checks, which suggests the market may already be pricing in a lot of good news. Next, we will unpack what different valuation methods say about the stock, before finishing with a more intuitive way to think about its true long term value.
Palo Alto Networks scores just 1/6 on our valuation checks. See what other red flags we found in the full valuation breakdown.
Approach 1: Palo Alto Networks Discounted Cash Flow (DCF) Analysis
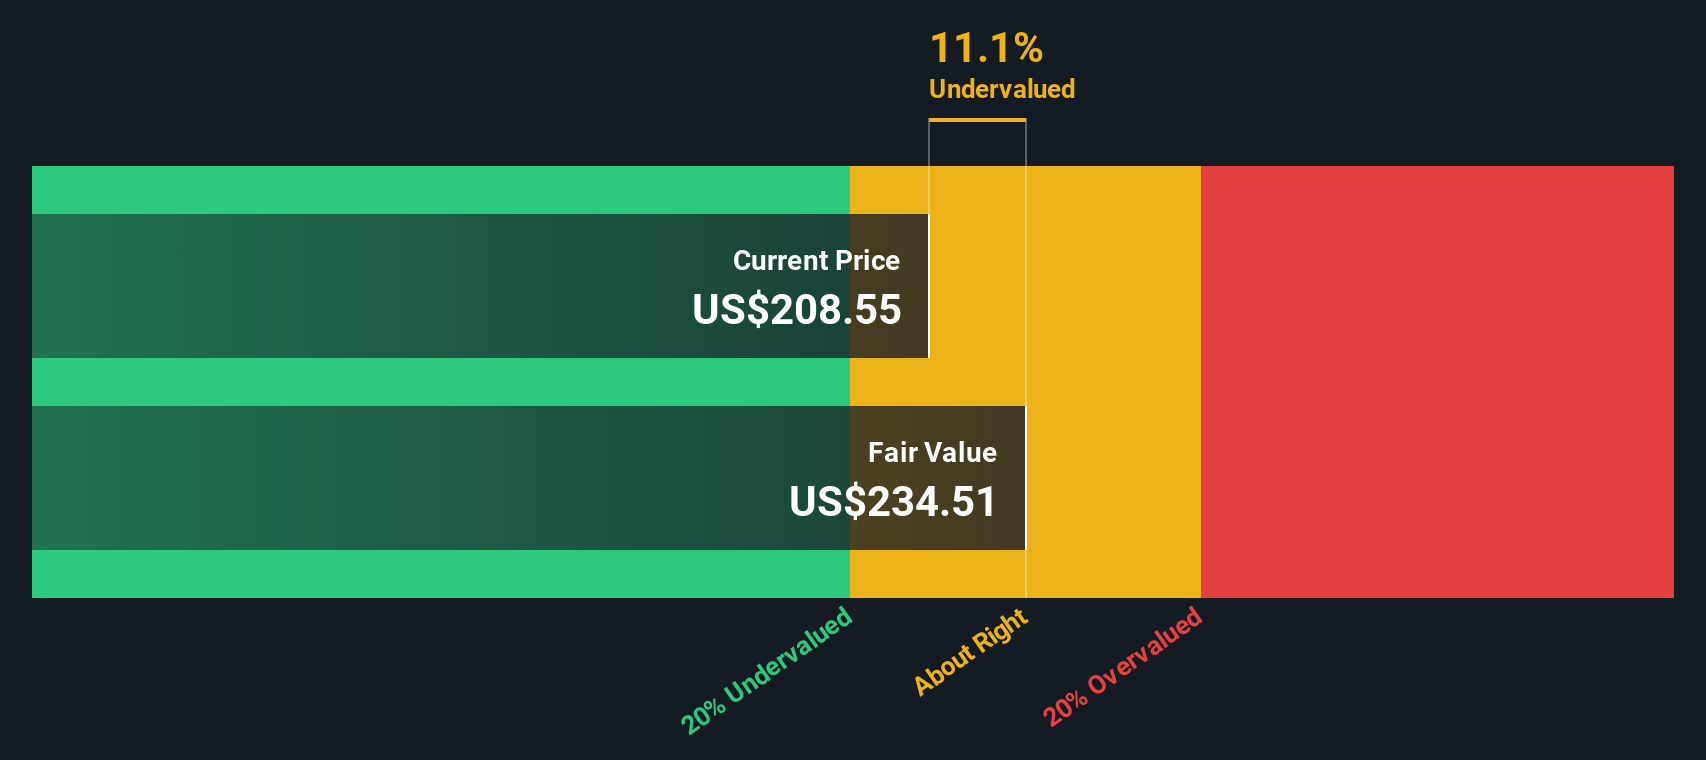
A Discounted Cash Flow model estimates what a company is worth by projecting its future cash flows and then discounting those back to today in $ terms. For Palo Alto Networks, the model starts with last twelve month Free Cash Flow of roughly $3.8 billion, then layers on analyst forecasts for the next few years and longer term growth assumptions provided by Simply Wall St.
On this basis, Free Cash Flow is projected to rise to about $8.0 billion by 2030, with a two stage Free Cash Flow to Equity approach used to reflect faster growth in the near term and a gradual slowdown later. When those projected cash flows are discounted back, the intrinsic value comes out at roughly $226.81 per share.
Compared with the current share price, this implies the stock is about 15.5% undervalued. This suggests the market is not fully pricing in Palo Alto Networks cash generation potential and its long term growth runway.
Result: UNDERVALUED
Our Discounted Cash Flow (DCF) analysis suggests Palo Alto Networks is undervalued by 15.5%. Track this in your watchlist or portfolio, or discover 907 more undervalued stocks based on cash flows.
Approach 2: Palo Alto Networks Price vs Earnings
For profitable companies like Palo Alto Networks, the price to earnings (PE) ratio is a useful way to see how much investors are paying for each dollar of current profit. A higher PE can be justified when a business is expected to grow faster and is seen as lower risk, while slower growth or higher uncertainty usually means a lower, more conservative multiple is appropriate.
Palo Alto Networks currently trades on a rich PE of about 119.6x, well above both the broader Software industry average of roughly 32.9x and an average of 48.0x for its listed peers. To put that into better context, Simply Wall St calculates a proprietary Fair Ratio of around 43.3x, which reflects what investors might typically pay given Palo Alto Networks earnings growth outlook, margins, size and risk profile.
This Fair Ratio is more informative than a simple peer or industry comparison because it explicitly adjusts for company specific drivers like growth, profitability, industry dynamics and market cap. When compared with the current 119.6x PE, it suggests the shares are pricing in far more optimism than the fundamentals alone would support.
Result: OVERVALUED
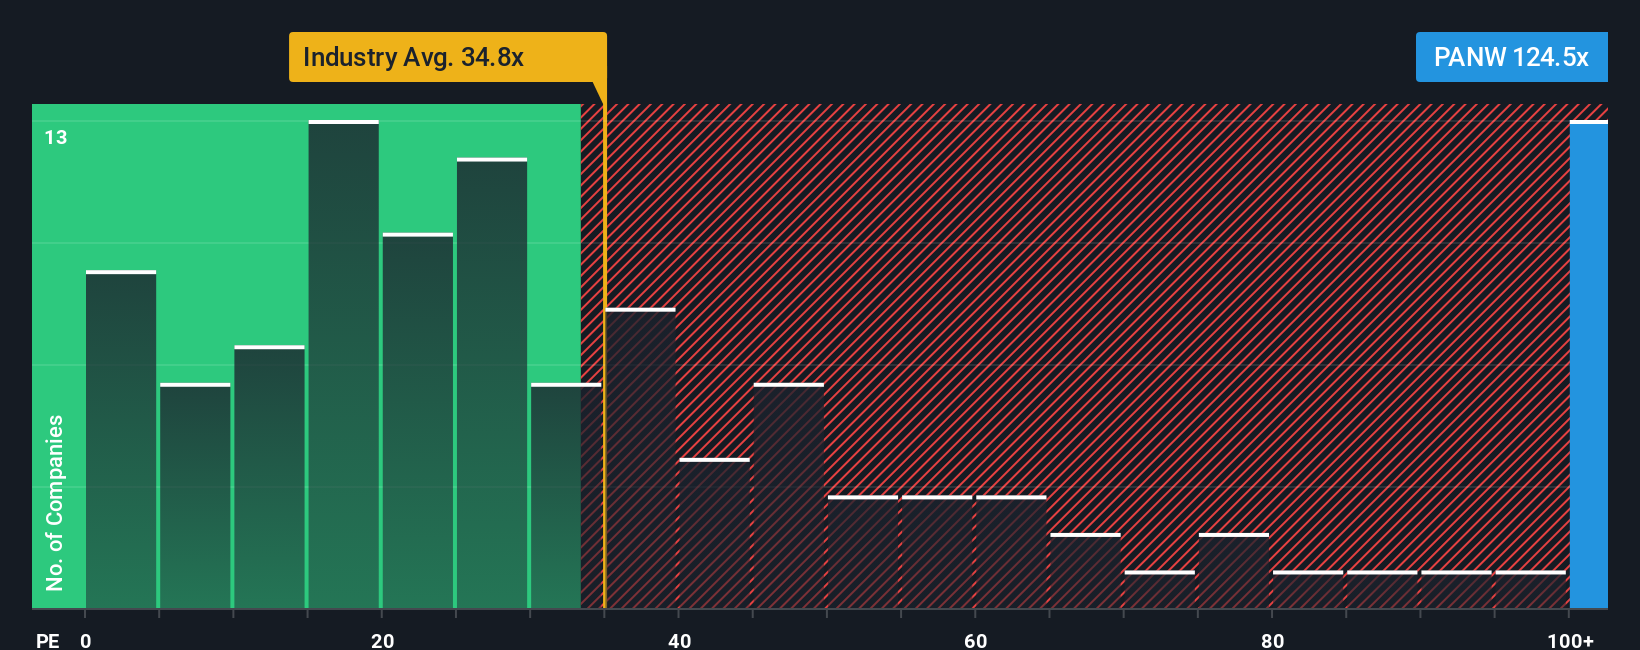
PE ratios tell one story, but what if the real opportunity lies elsewhere? Discover 1448 companies where insiders are betting big on explosive growth.
Upgrade Your Decision Making: Choose your Palo Alto Networks Narrative
Earlier we mentioned that there is an even better way to understand valuation, so let us introduce you to Narratives, a simple way to connect your view of Palo Alto Networks business to a concrete financial forecast and fair value estimate.
A Narrative is your story behind the numbers, where you spell out what you believe about future revenue, earnings and margins, and link that to a fair value that you can directly compare with today’s share price to decide whether to buy, hold or sell.
On Simply Wall St’s Community page, millions of investors use Narratives as an easy, accessible tool that automatically updates when new information like earnings, product launches or data breaches change the outlook, so your story and valuation are always kept current.
For Palo Alto Networks, one investor’s bullish Narrative might lean heavily on accelerating AI security adoption, margin expansion and platformization, leading to a higher fair value than today’s price. In contrast, a more cautious investor might focus on integration risks, competition and regulatory pressures, resulting in a much lower fair value and a decision to wait or trim their position.
Do you think there's more to the story for Palo Alto Networks? Head over to our Community to see what others are saying!
This article by Simply Wall St is general in nature. We provide commentary based on historical data and analyst forecasts only using an unbiased methodology and our articles are not intended to be financial advice. It does not constitute a recommendation to buy or sell any stock, and does not take account of your objectives, or your financial situation. We aim to bring you long-term focused analysis driven by fundamental data. Note that our analysis may not factor in the latest price-sensitive company announcements or qualitative material. Simply Wall St has no position in any stocks mentioned.
Have feedback on this article? Concerned about the content? Get in touch with us directly. Alternatively, email editorial-team@simplywallst.com