
Is It Too Late to Consider ASML After Its Strong 2025 Rally and China Headwinds?
- Wondering if ASML Holding is still worth buying after its huge run, or if the smart move now is to wait for a better entry point?
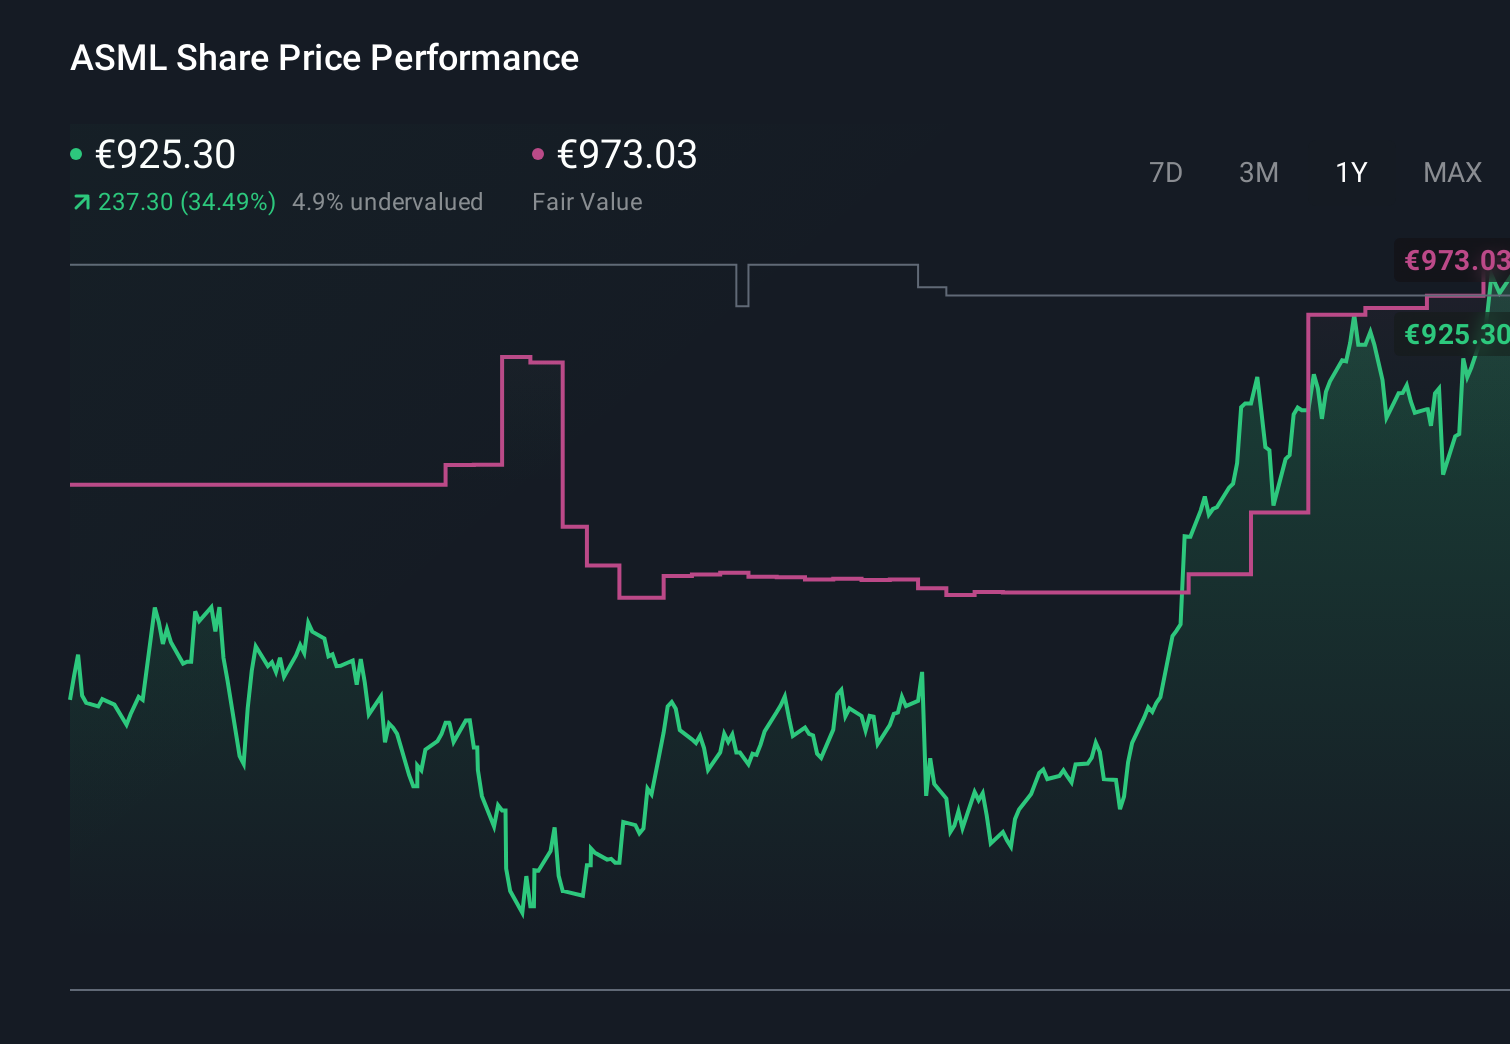
- The stock has slipped 2.8% over the last week but is still up 3.8% over the past month, with a hefty 34.1% gain year to date and 35.9% over the last year, reinforcing its long term growth story.
- Recent headlines have focused on ASML's dominant role in supplying advanced lithography tools for cutting edge chips and the impact of ongoing export restrictions to China, which investors are watching closely. At the same time, long term themes like AI data centers and high performance computing are keeping demand expectations for its technology firmly in the spotlight.
- Right now, ASML scores a 3 out of 6 on our undervaluation checks, which suggests the market might be partially pricing in its strengths but not fully. Next, we will dig into what different valuation methods say about the stock and then finish with an even more practical way to think about ASML's true value.
Approach 1: ASML Holding Discounted Cash Flow (DCF) Analysis
A Discounted Cash Flow model estimates what a business is worth by projecting its future cash flows and then discounting them back to today, using a required rate of return. For ASML Holding, the model uses a 2 stage Free Cash Flow to Equity approach based on cash flow projections.
ASML generated trailing twelve month free cash flow of about €8.6 billion, and analysts expect this to rise steadily, with Simply Wall St extrapolating to roughly €23.0 billion by 2035. These projections reflect strong anticipated growth as demand builds for advanced lithography tools supporting AI and high performance chips.
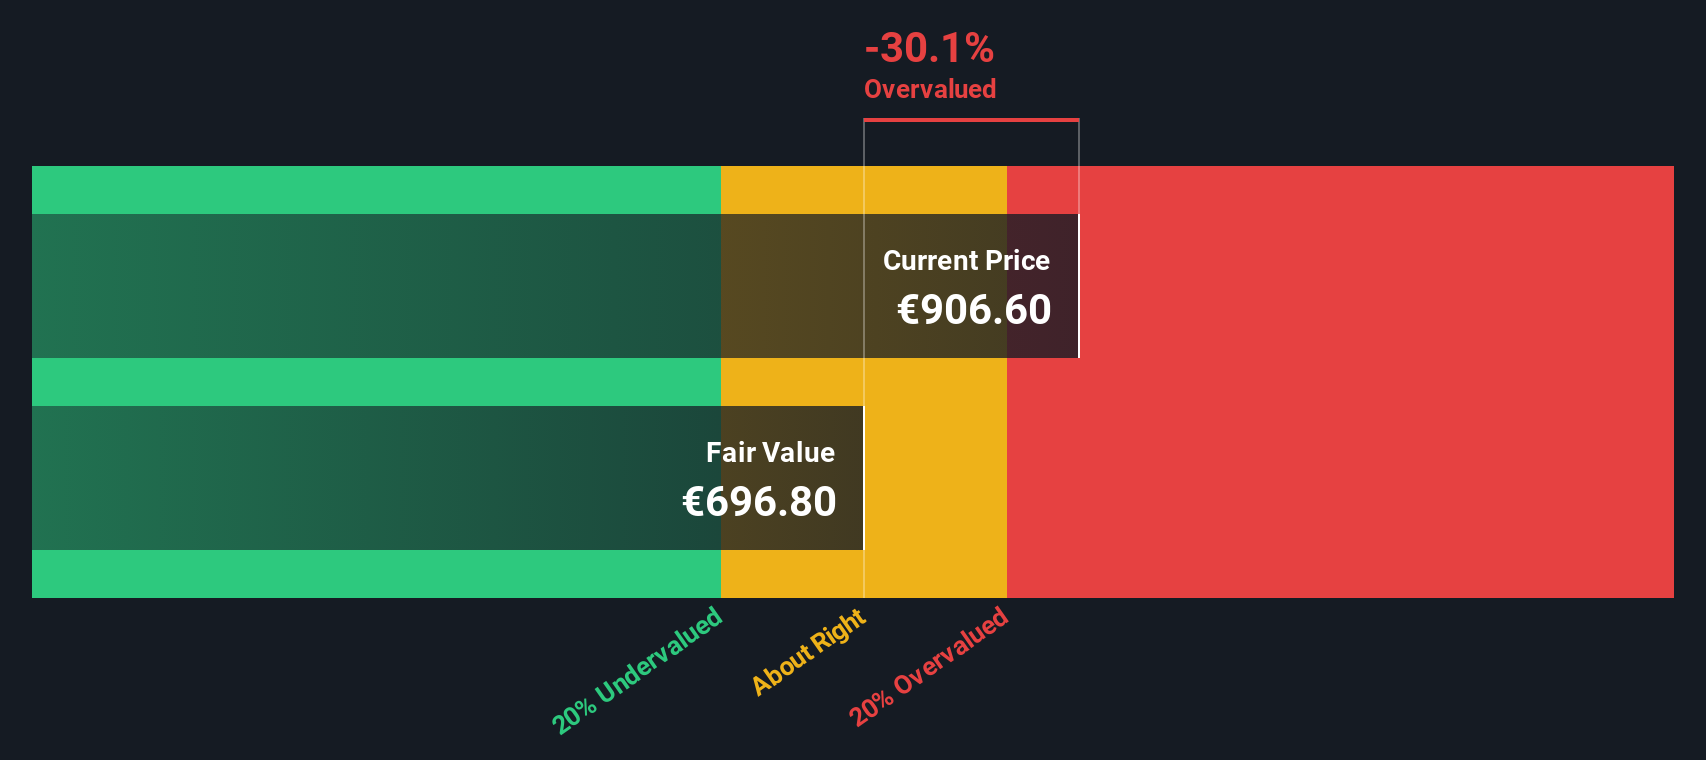
When these future cash flows are discounted back to today, the DCF model arrives at an estimated intrinsic value of about €704 per share. Compared with the current market price, this implies ASML is roughly 31.4% overvalued on a cash flow basis, suggesting the market is already pricing in a very optimistic growth path.
Result: OVERVALUED
Our Discounted Cash Flow (DCF) analysis suggests ASML Holding may be overvalued by 31.4%. Discover 907 undervalued stocks or create your own screener to find better value opportunities.
Approach 2: ASML Holding Price vs Earnings
For profitable businesses like ASML, the Price to Earnings ratio is a useful way to judge valuation because it links what investors pay directly to the profits the company generates. In general, faster growing and lower risk companies can justify a higher PE ratio. In contrast, slower growth or higher uncertainty usually calls for a lower, more conservative multiple.
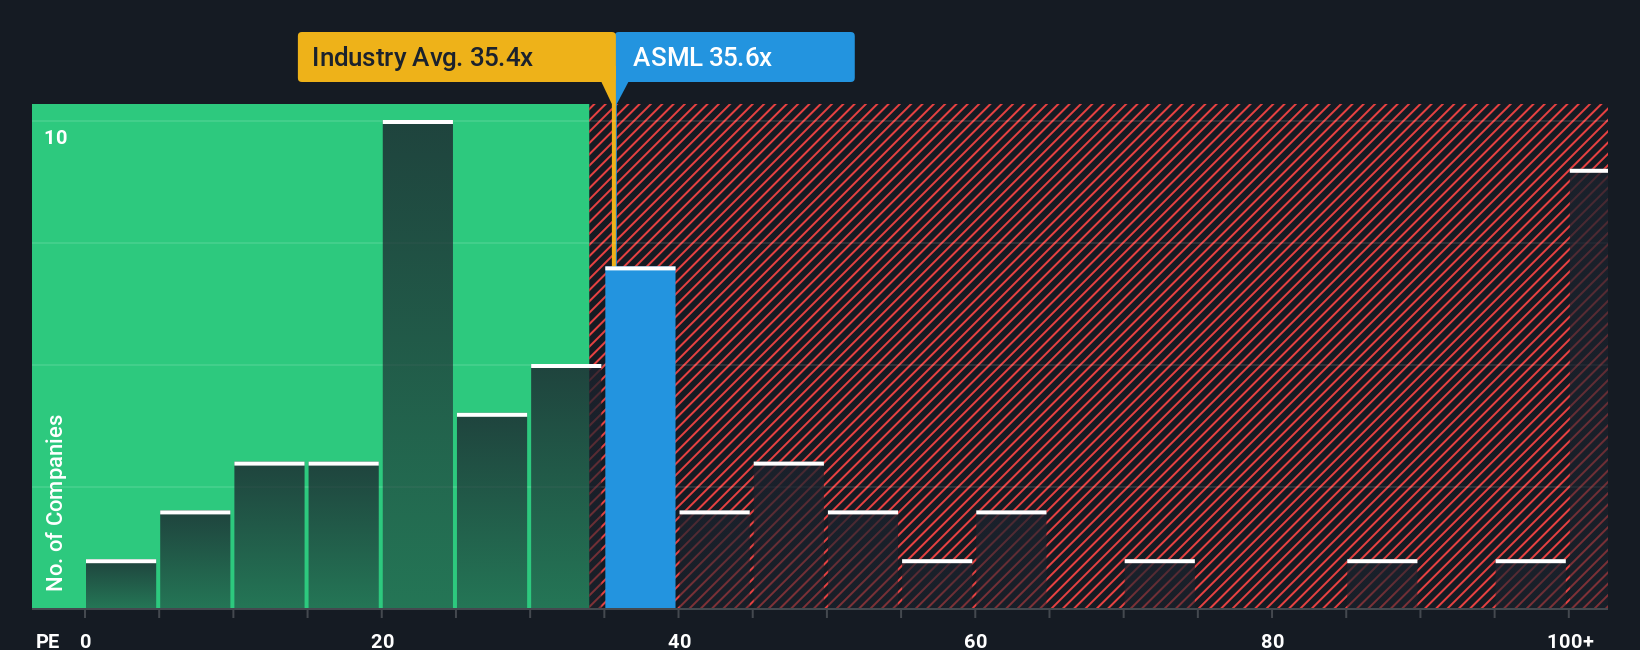
ASML currently trades on a PE of about 37.9x. That sits above the broader Semiconductor industry average of roughly 34.7x, but below the peer group average of around 42.4x. To go a step further, Simply Wall St calculates a proprietary Fair Ratio of 43.0x for ASML, which reflects its specific mix of earnings growth, profitability, industry positioning, market cap and risk profile. This tailored Fair Ratio is more insightful than a blunt comparison to peers or the sector because it adjusts for the characteristics that make ASML different rather than assuming all chip stocks deserve the same multiple.
With ASML trading at 37.9x versus an estimated Fair Ratio of 43.0x, the shares appear modestly undervalued on a PE basis.
Result: UNDERVALUED
PE ratios tell one story, but what if the real opportunity lies elsewhere? Discover 1448 companies where insiders are betting big on explosive growth.
Upgrade Your Decision Making: Choose your ASML Holding Narrative
Earlier we mentioned that there is an even better way to understand valuation, so let us introduce you to Narratives, a simple framework that lets you turn your view of ASML Holding into a story backed by numbers like fair value, revenue growth, earnings and margins. A Narrative links what you believe about the business, for example AI demand, export risks or competitive threats, to a financial forecast and then to a fair value estimate, so you can clearly see how your assumptions translate into a buy, hold or sell stance. On Simply Wall St, Narratives are easy to use and live inside the Community page, where millions of investors can build and compare their views, then quickly check whether their Fair Value is above or below today’s Price. Because Narratives update dynamically as new earnings, news or guidance arrive, your view of ASML never goes stale and you can adjust your decisions in real time. For example, one ASML Narrative might see fair value at about €500 with cautious growth, while another might see more than €1,000 on stronger AI and High NA adoption assumptions, and both can coexist and evolve as new data comes in.
For ASML Holding, however, we will make it really easy for you with previews of two leading ASML Holding Narratives:
Fair Value: €1,000.00
Implied Undervaluation vs Last Close: -7.5%
Forecast Revenue Growth: 17.26%
- Frames ASML as a long term compounder with a monopoly in EUV tools that power advanced chips for AI, smartphones and data centers.
- Highlights strong Q2 2025 execution, a growing backlog and high margin recurring service revenue that smooths the cycle.
- Views recent share price weakness and management’s cautious near term guidance as a buy the dip opportunity for patient investors.
Fair Value: €864.91
Implied Overvaluation vs Last Close: 7.0%
Forecast Revenue Growth: 9.65%
- Emphasizes that ASML’s dominant EUV position and strong growth outlook are already well recognized by the market.
- Points to geopolitical tension, export controls and China’s push for semiconductor self sufficiency as medium term strategic risks.
- Argues that at a rich forward PE multiple, investors may be paying up for perfection, leaving limited margin of safety at current prices.
Do you think there's more to the story for ASML Holding? Head over to our Community to see what others are saying!
This article by Simply Wall St is general in nature. We provide commentary based on historical data and analyst forecasts only using an unbiased methodology and our articles are not intended to be financial advice. It does not constitute a recommendation to buy or sell any stock, and does not take account of your objectives, or your financial situation. We aim to bring you long-term focused analysis driven by fundamental data. Note that our analysis may not factor in the latest price-sensitive company announcements or qualitative material. Simply Wall St has no position in any stocks mentioned.
Have feedback on this article? Concerned about the content? Get in touch with us directly. Alternatively, email editorial-team@simplywallst.com