
Is Austal’s Surge in 2025 Justified by Its Cash Flow and Earnings Outlook?
- Wondering if Austal at $6.23 is still a smart buy after its big run, or if you would just be chasing momentum? Let us unpack what the current price really implies about its value.
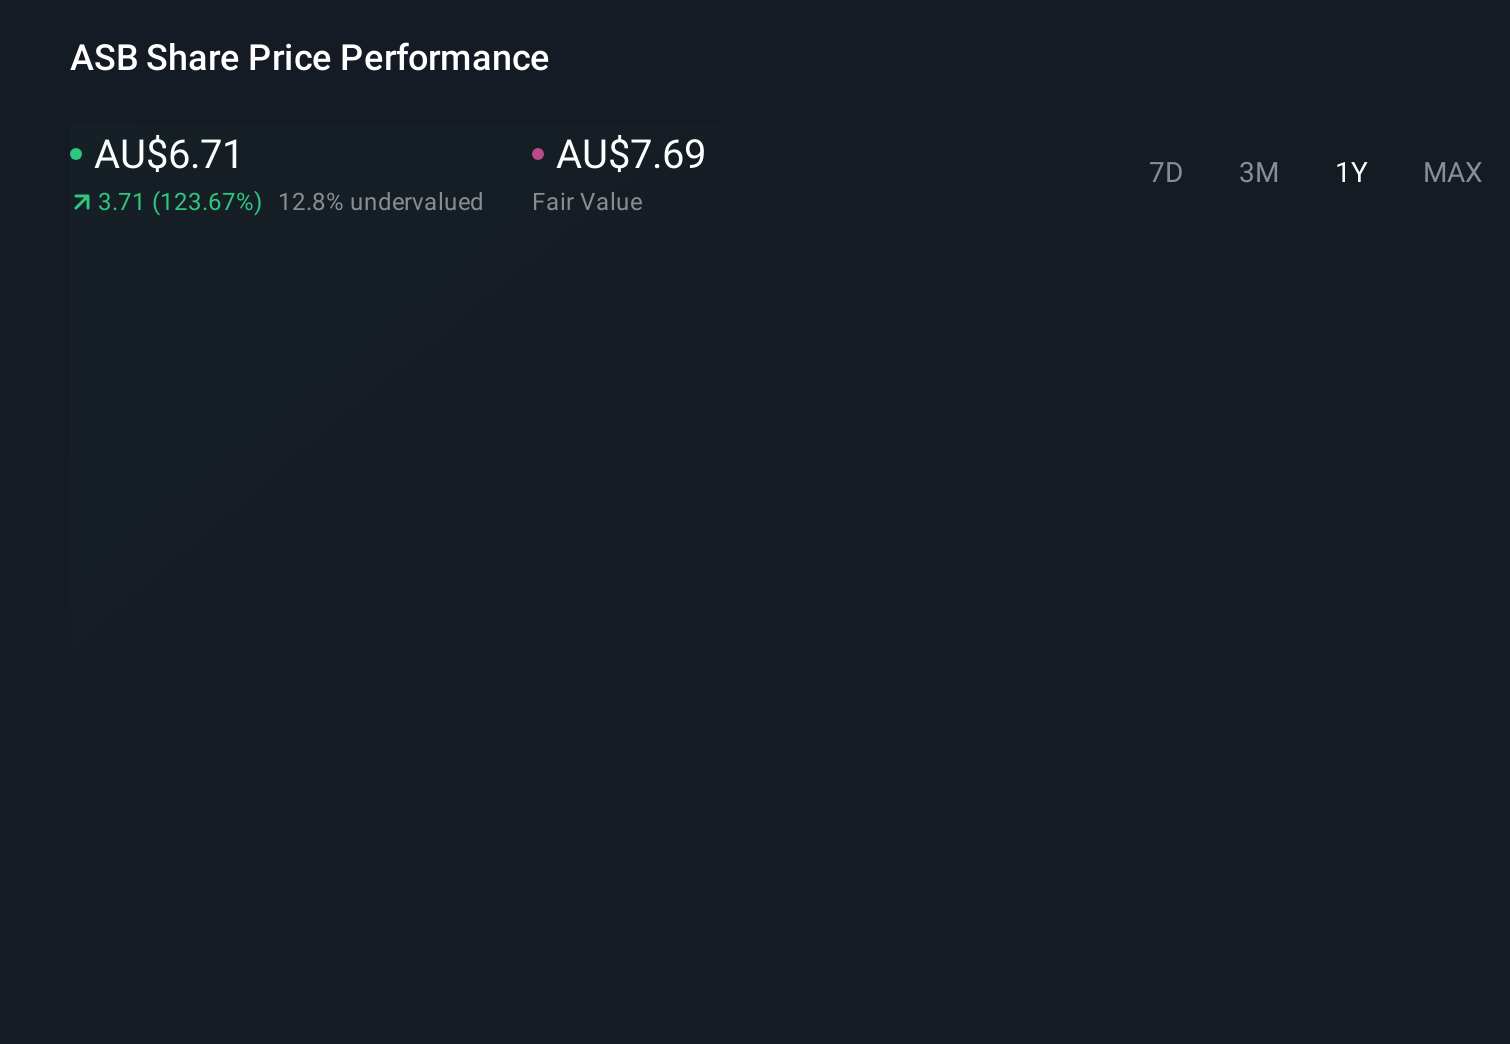
- The stock has slipped slightly in the short term, down 4.4% over the last week and 7.2% over the last month, but that comes after a huge rebound with shares up 101.0% year to date and 122.5% over the past year.
- Much of this surge has been driven by renewed optimism around Austal's defence shipbuilding contracts and progress on key naval programs, which have strengthened confidence in its long term revenue pipeline. At the same time, shifting geopolitics and higher defence spending expectations have pulled more investor attention toward specialist defence contractors such as Austal.
- Despite the rally, Austal still scores a solid 5/6 on our valuation checks, suggesting the market may not fully be pricing in its fundamentals yet. In the sections that follow, we will walk through the main valuation approaches and then finish with a more powerful way to think about what the stock is really worth.
Find out why Austal's 122.5% return over the last year is lagging behind its peers.
Approach 1: Austal Discounted Cash Flow (DCF) Analysis
A Discounted Cash Flow model projects a company’s future cash flows and then discounts them back to today’s value to estimate what the business is worth now. For Austal, the model uses a 2 Stage Free Cash Flow to Equity approach, starting from last twelve months Free Cash Flow of about A$259 million and then applying analyst forecasts for the next few years.
Analysts currently expect Austal’s Free Cash Flow to dip to around A$106 million in 2026 before recovering and climbing steadily, with projections (including Simply Wall St extrapolations beyond the explicit analyst horizon) reaching roughly A$333 million by 2030. Extending this trajectory further out, the present value of all these future cash flows results in an estimated intrinsic value of about A$20.22 per share.
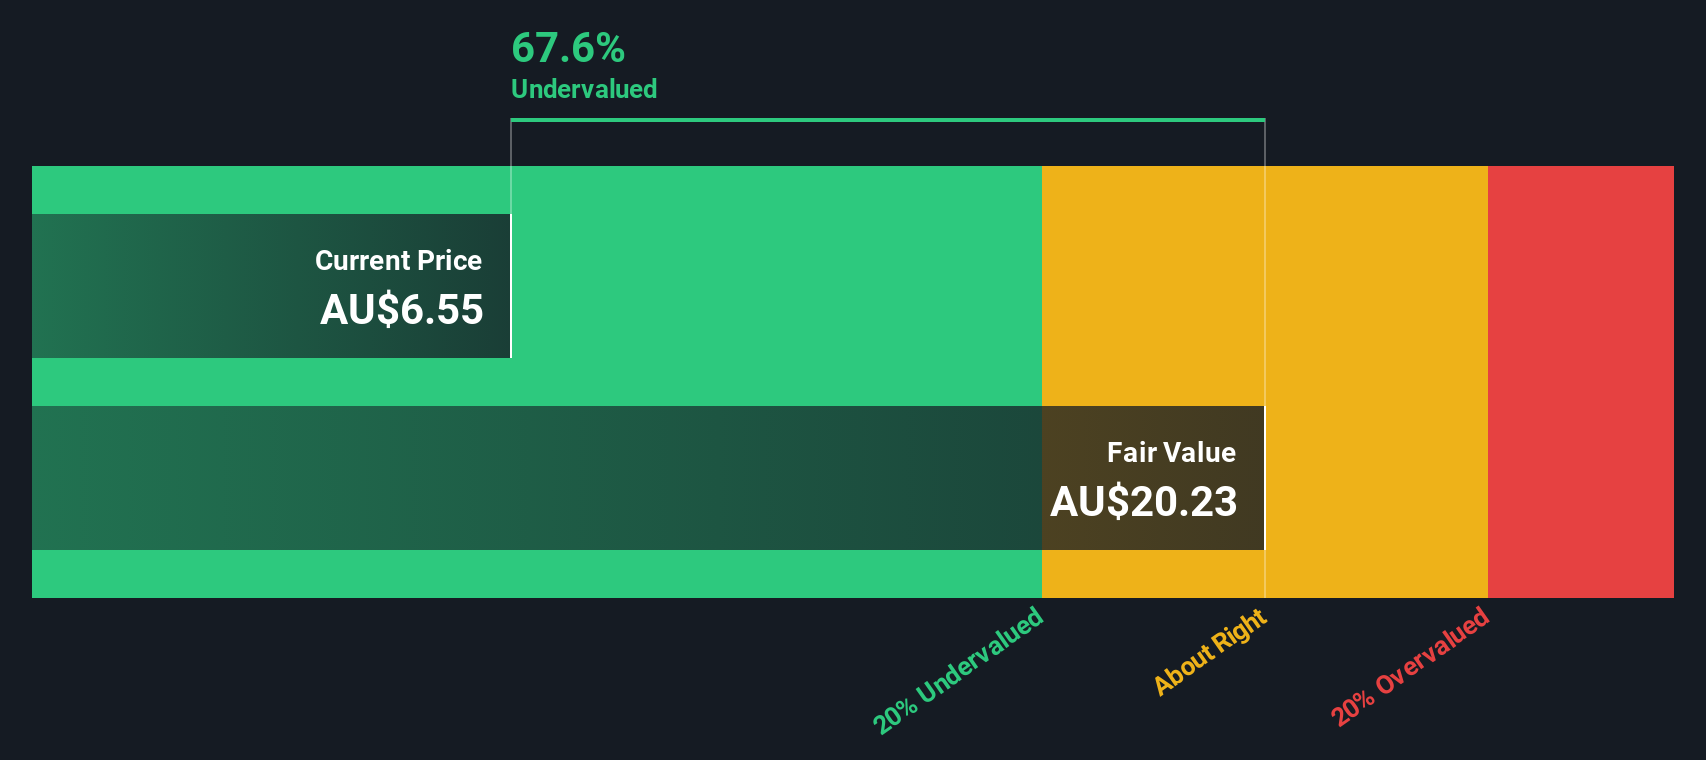
Compared with the recent share price of roughly A$6.23, the DCF suggests Austal is trading at about a 69.2% discount to its estimated fair value, implying meaningful upside if these cash flow assumptions prove accurate.
Result: UNDERVALUED
Our Discounted Cash Flow (DCF) analysis suggests Austal is undervalued by 69.2%. Track this in your watchlist or portfolio, or discover 907 more undervalued stocks based on cash flows.
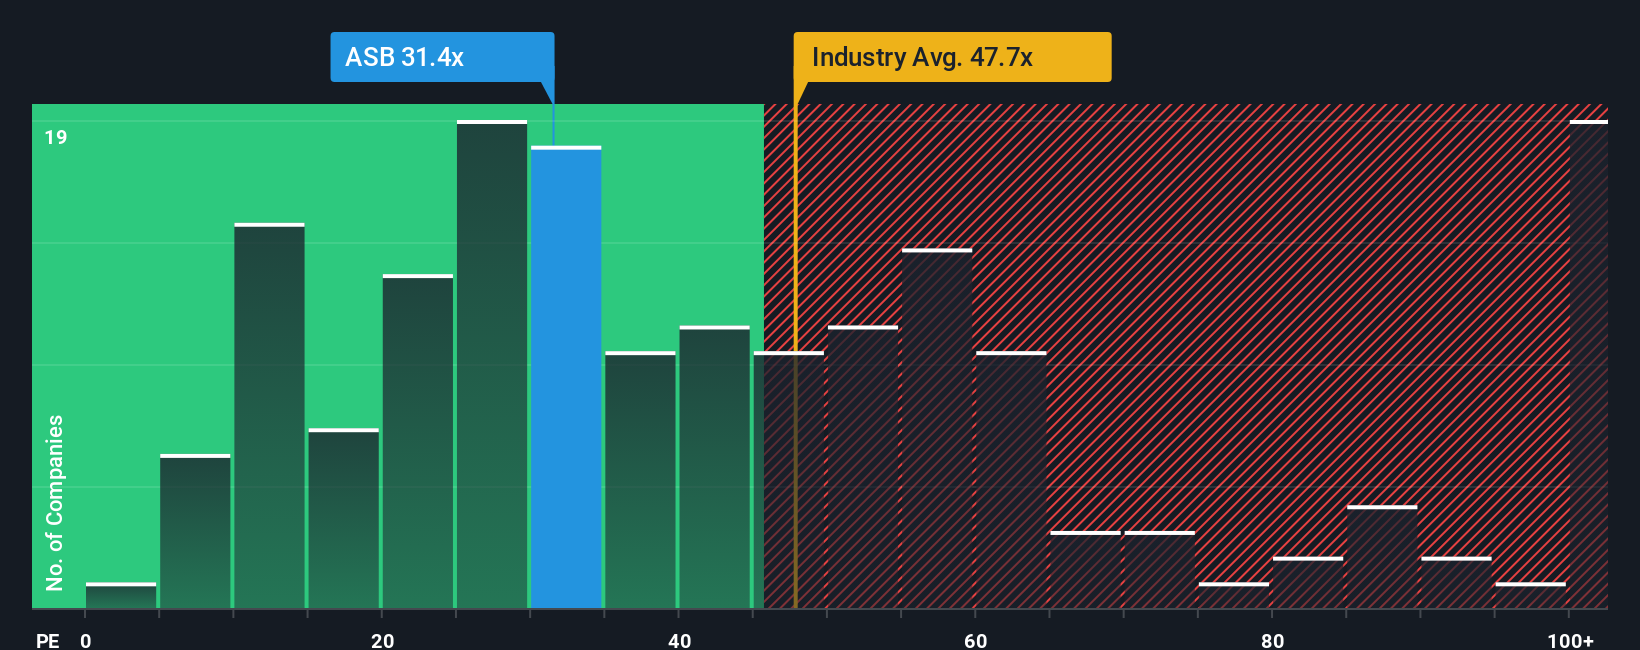
Approach 2: Austal Price vs Earnings
For a profitable company like Austal, the Price to Earnings (PE) ratio is a useful way to gauge how much investors are paying for each dollar of current profit. Higher growth prospects and lower perceived risk usually justify a higher PE, while slower growth or higher risk typically point to a lower, more conservative multiple.
Austal currently trades on a PE of about 29.2x, which sits below both the Aerospace and Defense industry average of roughly 46.7x and the peer group average of around 37.8x. To go a step further, Simply Wall St calculates a proprietary Fair Ratio of about 27.9x for Austal, reflecting what its PE should be given its earnings growth outlook, margins, risk profile, industry positioning and market cap.
This Fair Ratio is more informative than a simple peer or industry comparison because it adjusts for Austal’s specific fundamentals rather than assuming all defense names deserve the same multiple. With Austal trading only slightly above its Fair Ratio, the stock appears modestly expensive on earnings, but not excessively so.
Result: OVERVALUED
PE ratios tell one story, but what if the real opportunity lies elsewhere? Discover 1448 companies where insiders are betting big on explosive growth.
Upgrade Your Decision Making: Choose your Austal Narrative
Earlier we mentioned that there is an even better way to understand valuation, so let us introduce you to Narratives, an approach on Simply Wall St’s Community page that lets you tell the story behind your numbers by linking your view of a company to explicit forecasts for its future revenue, earnings, and margins, then translating that into a Fair Value you can compare directly with today’s share price. A Narrative is simply your investing storyline made concrete, connecting what you believe about Austal’s contracts, shipyard expansion, and risks to a living financial model that updates dynamically as new news, results, or guidance are released, so your Fair Value view is never static. This makes it far easier to decide when to buy or sell, because you can see at a glance whether your Fair Value sits above or below the current market price and by how much. For example, one Austal Narrative might lean bullish and land near A$8.00 per share, while a more cautious Narrative might sit closer to A$5.58, clearly showing how different perspectives lead to different, but transparent, valuation outcomes.
Do you think there's more to the story for Austal? Head over to our Community to see what others are saying!
This article by Simply Wall St is general in nature. We provide commentary based on historical data and analyst forecasts only using an unbiased methodology and our articles are not intended to be financial advice. It does not constitute a recommendation to buy or sell any stock, and does not take account of your objectives, or your financial situation. We aim to bring you long-term focused analysis driven by fundamental data. Note that our analysis may not factor in the latest price-sensitive company announcements or qualitative material. Simply Wall St has no position in any stocks mentioned.
Have feedback on this article? Concerned about the content? Get in touch with us directly. Alternatively, email editorial-team@simplywallst.com