
Has UnitedHealth’s 32% Slide Created an Opportunity Amid Medicare Advantage Scrutiny?
- If you are wondering whether UnitedHealth Group is starting to look like a deal after a rough stretch, you are not alone. This article is going to walk through whether the current price really stacks up against the company’s fundamentals.
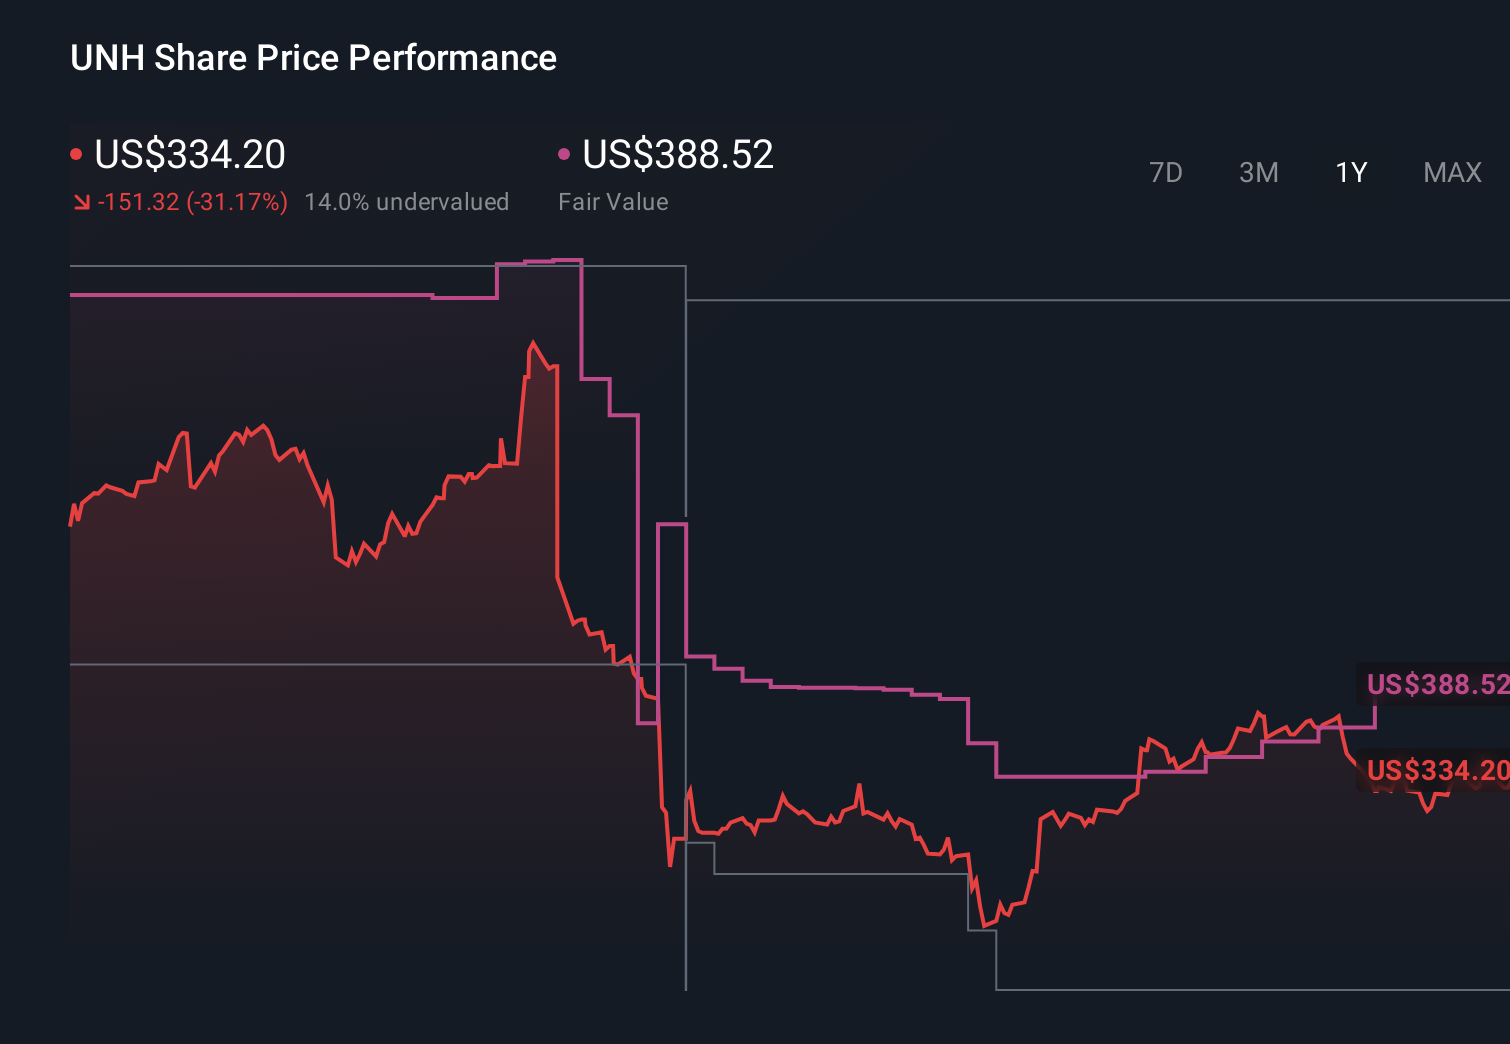
- The stock has bounced about 3.3% over the last week and is roughly flat over the past month, but it is still down around 32.2% year to date and 32.7% over the last year, a sharp reset that has investors rethinking both its growth potential and risk profile.
- Recent headlines have focused on regulatory pressure around Medicare Advantage and ongoing scrutiny of managed care costs, which have weighed on sentiment and helped explain the steep pullback. At the same time, investors are watching how UnitedHealth manages integration and operational risks in its broader healthcare services ecosystem, adding another layer of complexity to how the market is pricing the stock.
- On our checklist of six valuation tests, UnitedHealth scores a solid 5 out of 6, suggesting it may be undervalued on most metrics. Next we will break down what those different valuation approaches say, before finishing with a more complete way to think about what the stock is really worth.
Find out why UnitedHealth Group's -32.7% return over the last year is lagging behind its peers.
Approach 1: UnitedHealth Group Discounted Cash Flow (DCF) Analysis
A Discounted Cash Flow model estimates what a company is worth today by extrapolating its future cash flow projections and then discounting those back to their present value. For UnitedHealth Group, the model uses a 2 stage Free Cash Flow to Equity framework based on cash flows in $.
UnitedHealth generated trailing twelve month free cash flow of about $17.1 billion, and analysts expect this to grow steadily, with Simply Wall St extrapolating those forecasts further out. Under these assumptions, projected free cash flow rises to roughly $39.1 billion by 2035, reflecting robust but gradually slowing growth as the business matures.
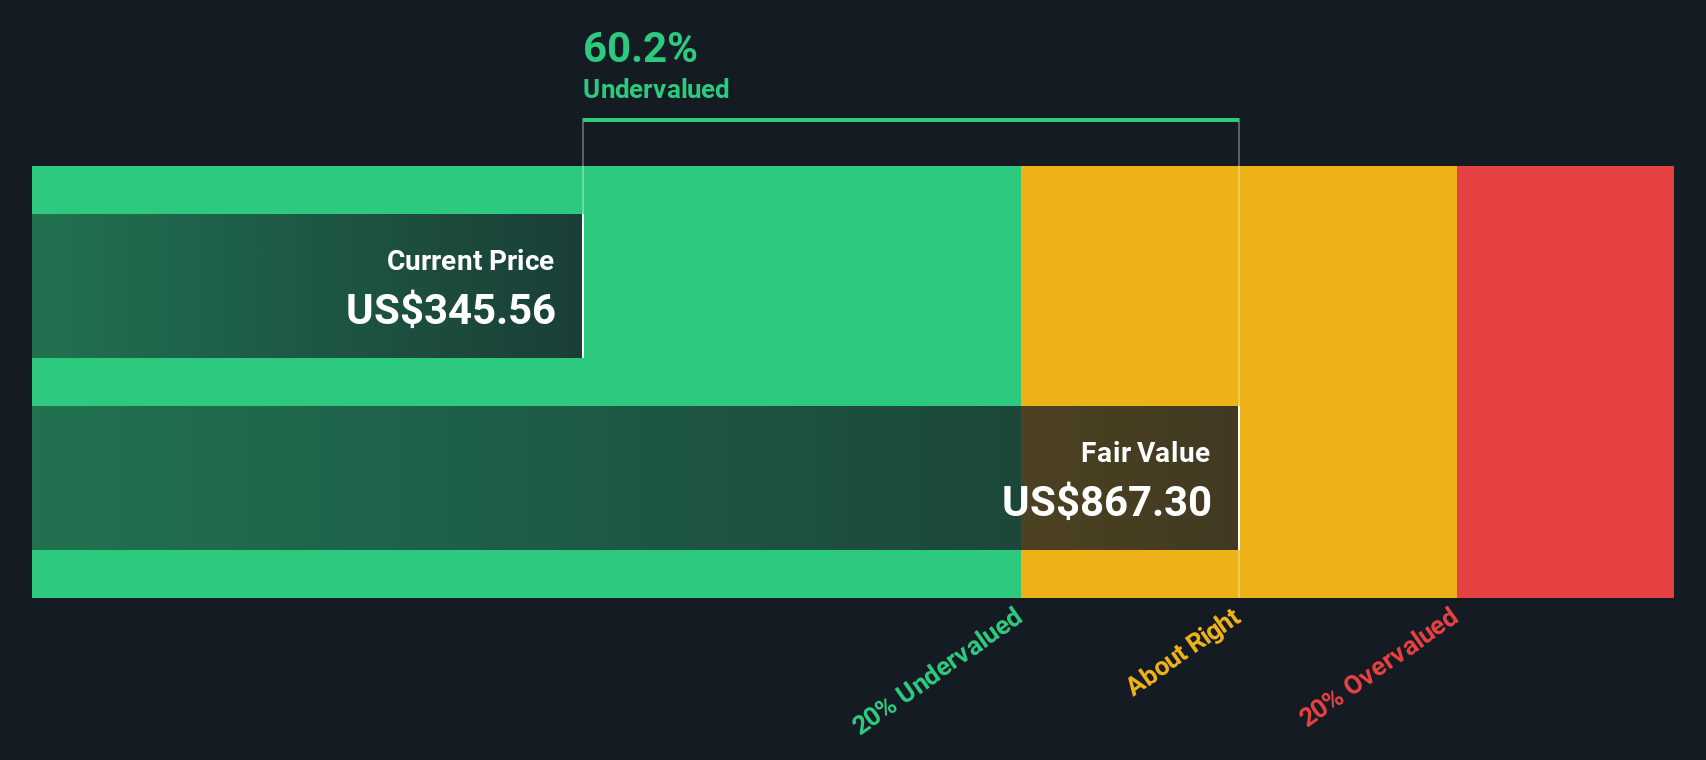
When all those future cash flows are discounted back using the DCF approach, the estimated intrinsic value comes out at about $837.43 per share. Compared with the current share price, this implies the stock is roughly 59.2% undervalued, a sizable gap that suggests the market is heavily discounting UnitedHealth’s long term cash generation potential.
Result: UNDERVALUED
Our Discounted Cash Flow (DCF) analysis suggests UnitedHealth Group is undervalued by 59.2%. Track this in your watchlist or portfolio, or discover 907 more undervalued stocks based on cash flows.
Approach 2: UnitedHealth Group Price vs Earnings
For a mature, consistently profitable business like UnitedHealth Group, the price to earnings, or PE, ratio is a useful way to gauge what investors are paying for each dollar of current earnings. In general, companies with stronger growth prospects and lower perceived risk can justify a higher PE, while slower growth or elevated uncertainty should pull that multiple down.
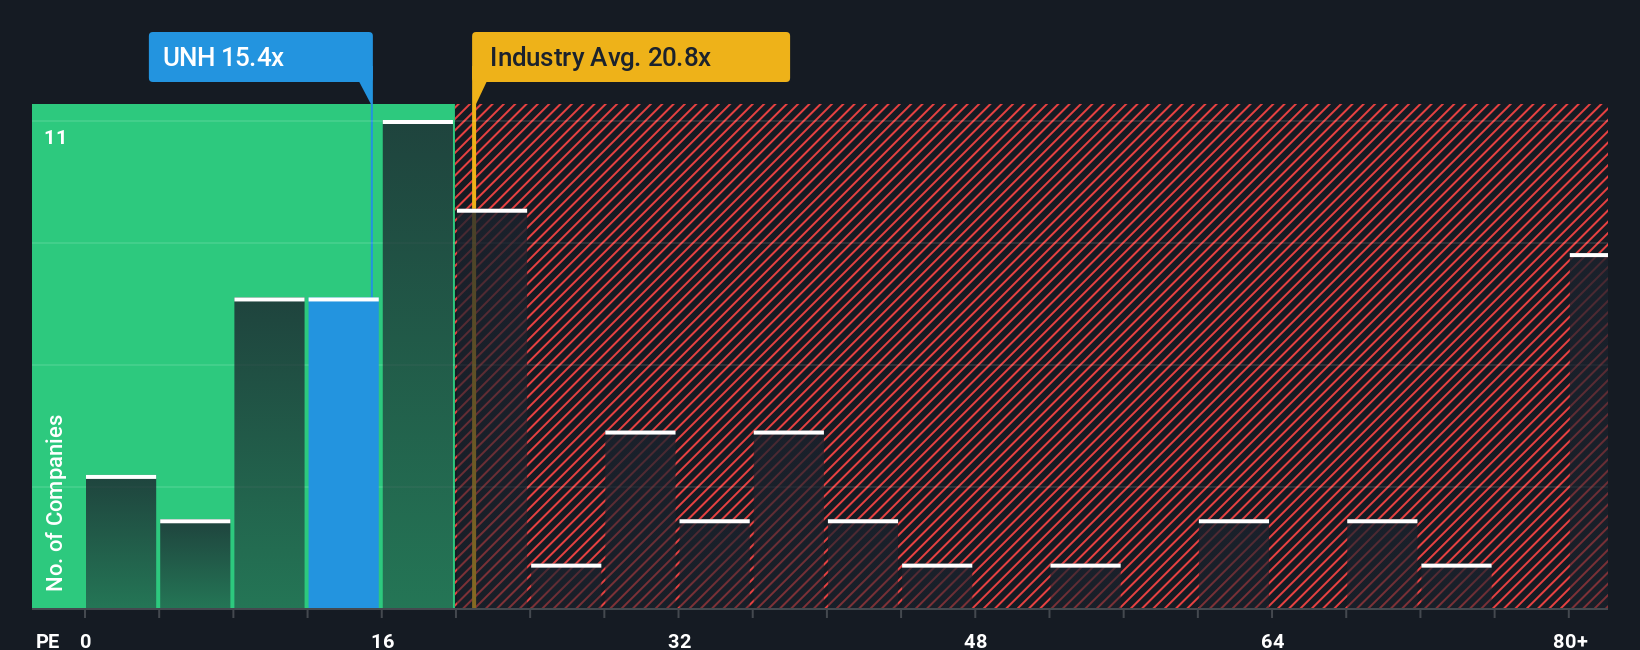
UnitedHealth currently trades on a PE of about 17.60x, which is meaningfully below both the Healthcare industry average of roughly 23.72x and the broader peer group average of about 23.09x. To go a step further than simple comparisons, Simply Wall St calculates a proprietary “Fair Ratio” of 39.36x for UnitedHealth, which reflects what its PE might be based on factors such as expected earnings growth, profitability, industry positioning, company size and risk profile.
This Fair Ratio framework is more tailored than just lining UnitedHealth up against sector or peer averages, because it explicitly incorporates the company’s own growth trajectory and risk characteristics rather than assuming all Healthcare names deserve similar multiples. Compared with that 39.36x Fair Ratio, the current 17.60x PE suggests the market is pricing UnitedHealth at a meaningful discount to what those fundamentals might warrant.
Result: UNDERVALUED
PE ratios tell one story, but what if the real opportunity lies elsewhere? Discover 1448 companies where insiders are betting big on explosive growth.
Upgrade Your Decision Making: Choose your UnitedHealth Group Narrative
Earlier we mentioned that there is an even better way to understand valuation, so let us introduce you to Narratives, which are simple, story driven frameworks that connect your view of a company to numbers like future revenue, earnings, margins and, ultimately, a fair value estimate. A Narrative turns your perspective on UnitedHealth Group into a structured forecast, links that forecast to a calculated fair value, and then compares that fair value with today’s share price so you can decide whether it looks more like a buy, a hold, or a sell. Narratives are available on Simply Wall St’s Community page, used by millions of investors, and they update dynamically as new information such as earnings, news, or regulatory changes comes in. For example, one UnitedHealth Narrative might assume margin recovery, revenue growth above 5 percent and a fair value near the upper analyst price target around $626, while a more cautious Narrative could lean on muted growth, sustained margin pressure and a fair value closer to the low end near $198, giving you a clear, side by side view of how different stories lead to different valuations.
Do you think there's more to the story for UnitedHealth Group? Head over to our Community to see what others are saying!
This article by Simply Wall St is general in nature. We provide commentary based on historical data and analyst forecasts only using an unbiased methodology and our articles are not intended to be financial advice. It does not constitute a recommendation to buy or sell any stock, and does not take account of your objectives, or your financial situation. We aim to bring you long-term focused analysis driven by fundamental data. Note that our analysis may not factor in the latest price-sensitive company announcements or qualitative material. Simply Wall St has no position in any stocks mentioned.
Have feedback on this article? Concerned about the content? Get in touch with us directly. Alternatively, email editorial-team@simplywallst.com