
Is It Too Late To Consider Citi After A 181% Three Year Surge?
- If you are wondering whether Citigroup is still a value play after such a big run, or if you have already missed the boat, you are in the right place to break that down calmly and clearly.
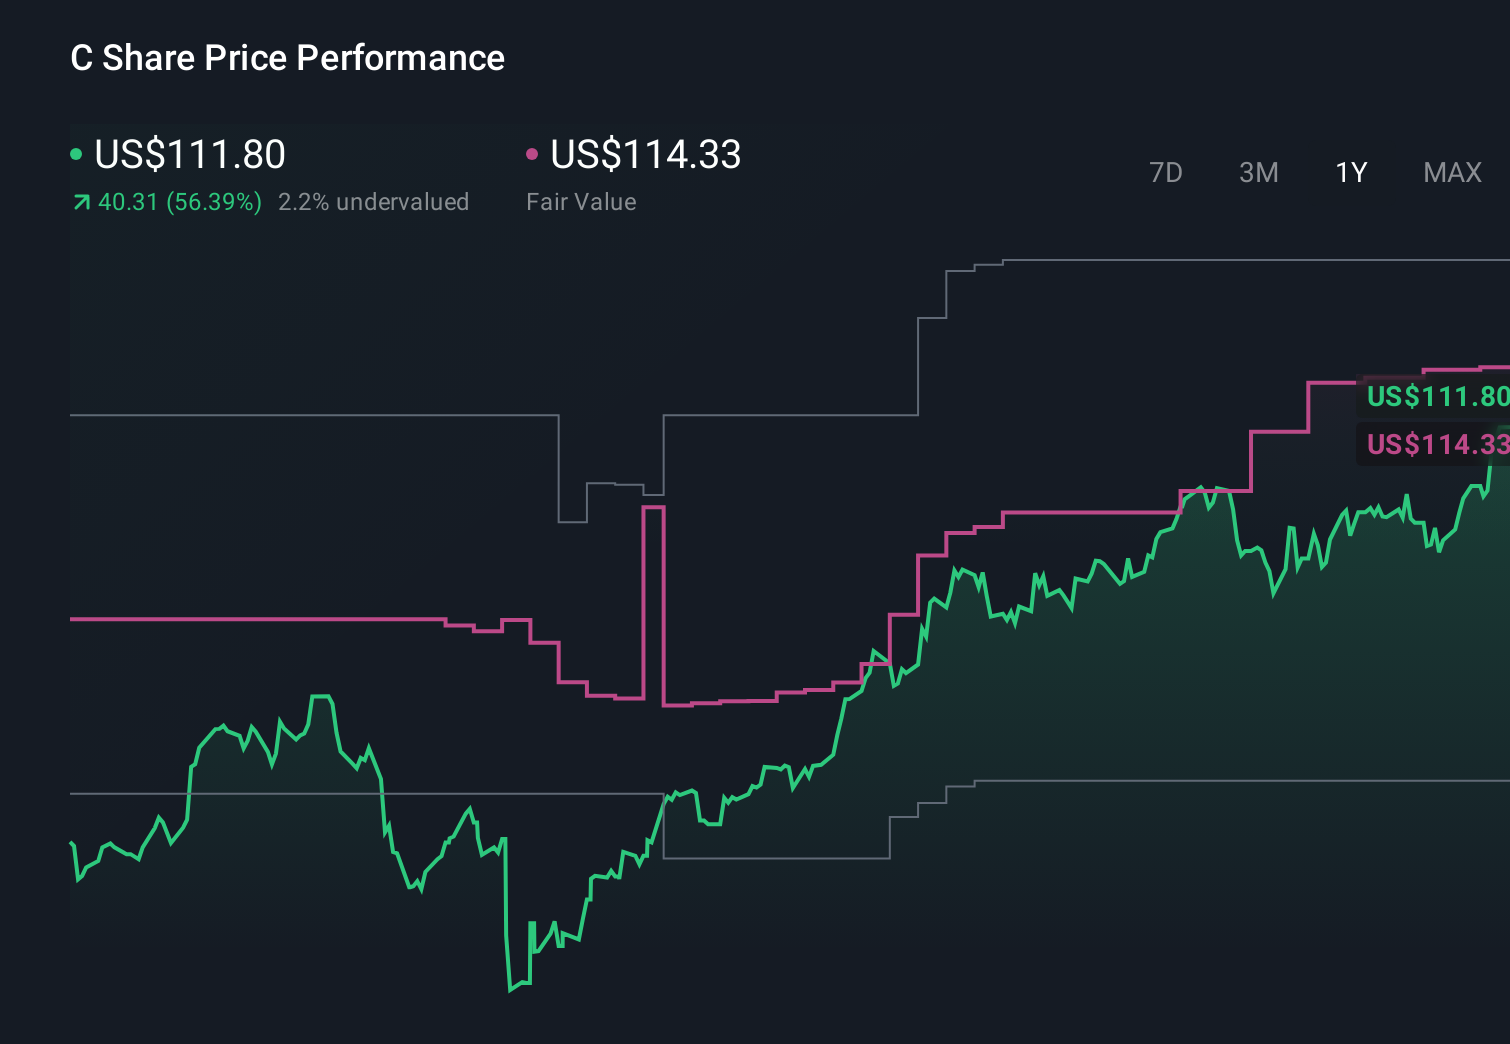
- The stock has climbed 2.7% over the last week, 8.7% over the last month, and an impressive 59.9% year to date, with a 61.8% gain over the past year and a massive 181.1% rise over three years. This performance has clearly shifted how the market views its risk and reward profile.
- Recent headlines have focused on Citigroup's ongoing restructuring efforts, regulatory simplification, and strategic refocus on core businesses, all aimed at making the bank leaner and more profitable over time. At the same time, investors have been watching its capital return plans and balance sheet strength as key signals that management is serious about unlocking value.
- Even after this rally, Citigroup only scores a 3/6 on our valuation checks. This suggests it still looks undervalued on some metrics but not across the board, which sets us up to dig into different valuation approaches now and, later on, explore an even better way to think about what the stock is really worth.
Approach 1: Citigroup Excess Returns Analysis
The Excess Returns model looks at how much value Citigroup can create above the basic return that equity investors demand, based on its profitability and growth in book value per share.
For Citigroup, the model uses a Book Value of $108.41 per share and a Stable EPS estimate of $16,152.07 per share, drawn from weighted future Return on Equity estimates from 14 analysts. With a Cost of Equity of $9.73 per share, the Excess Return is an enormous $16,142.33 per share, implying that the capital Citigroup deploys could earn far more than investors typically require.
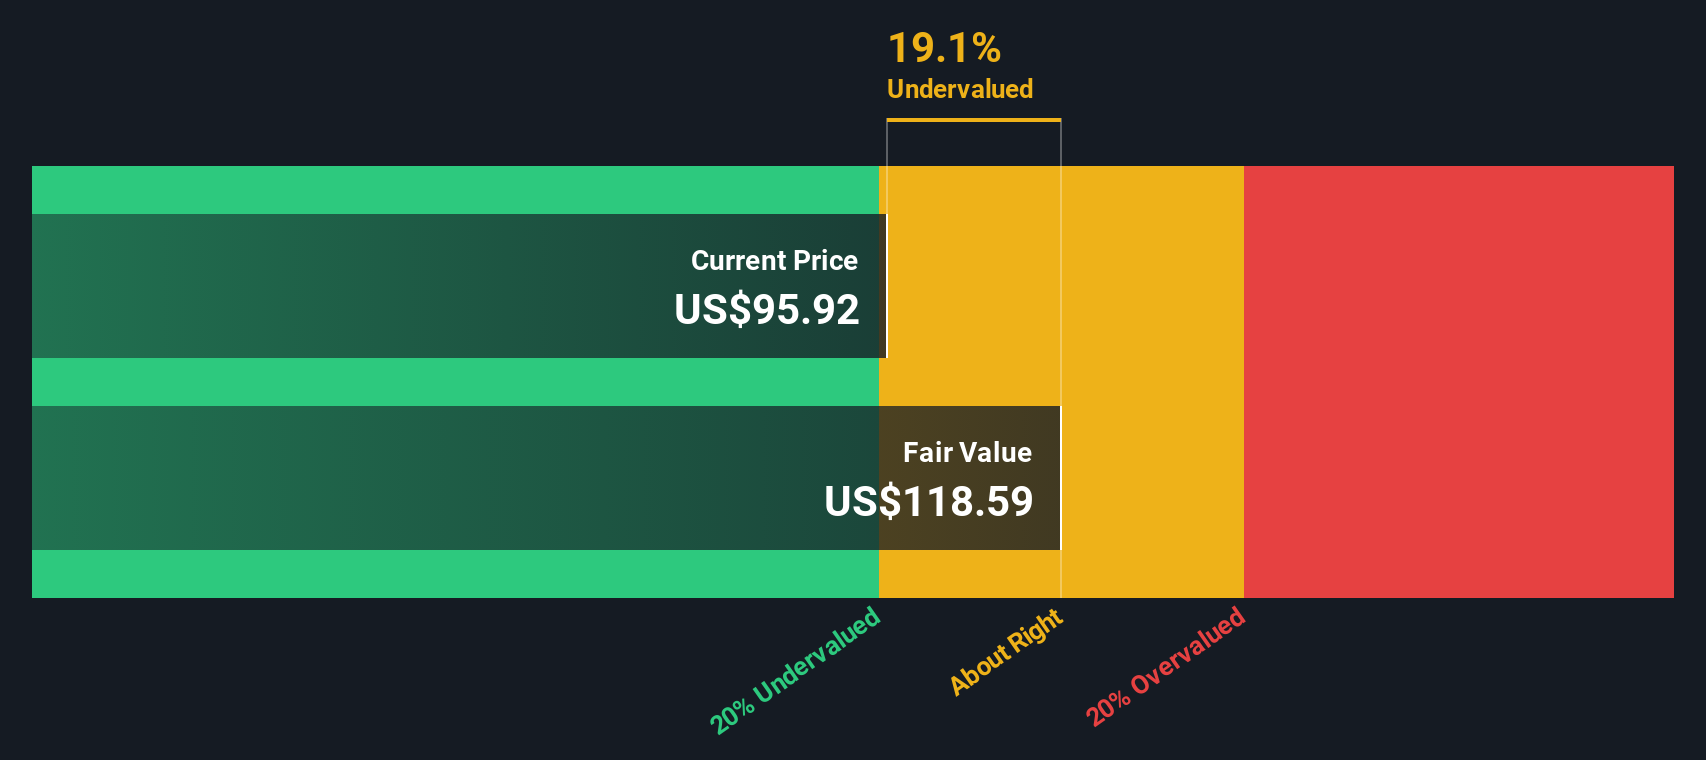
The Average Return on Equity embedded in this framework is an extremely high 13,591.93%, with a Stable Book Value of $118.84 per share, based on projections from 11 analysts. Plugging these inputs into the Excess Returns framework produces an implied intrinsic value that is 100.0% above the current share price, indicating that the stock screens as deeply undervalued under this lens.
Result: UNDERVALUED
Our Excess Returns analysis suggests Citigroup is undervalued by 100.0%. Track this in your watchlist or portfolio, or discover 907 more undervalued stocks based on cash flows.
Approach 2: Citigroup Price vs Earnings
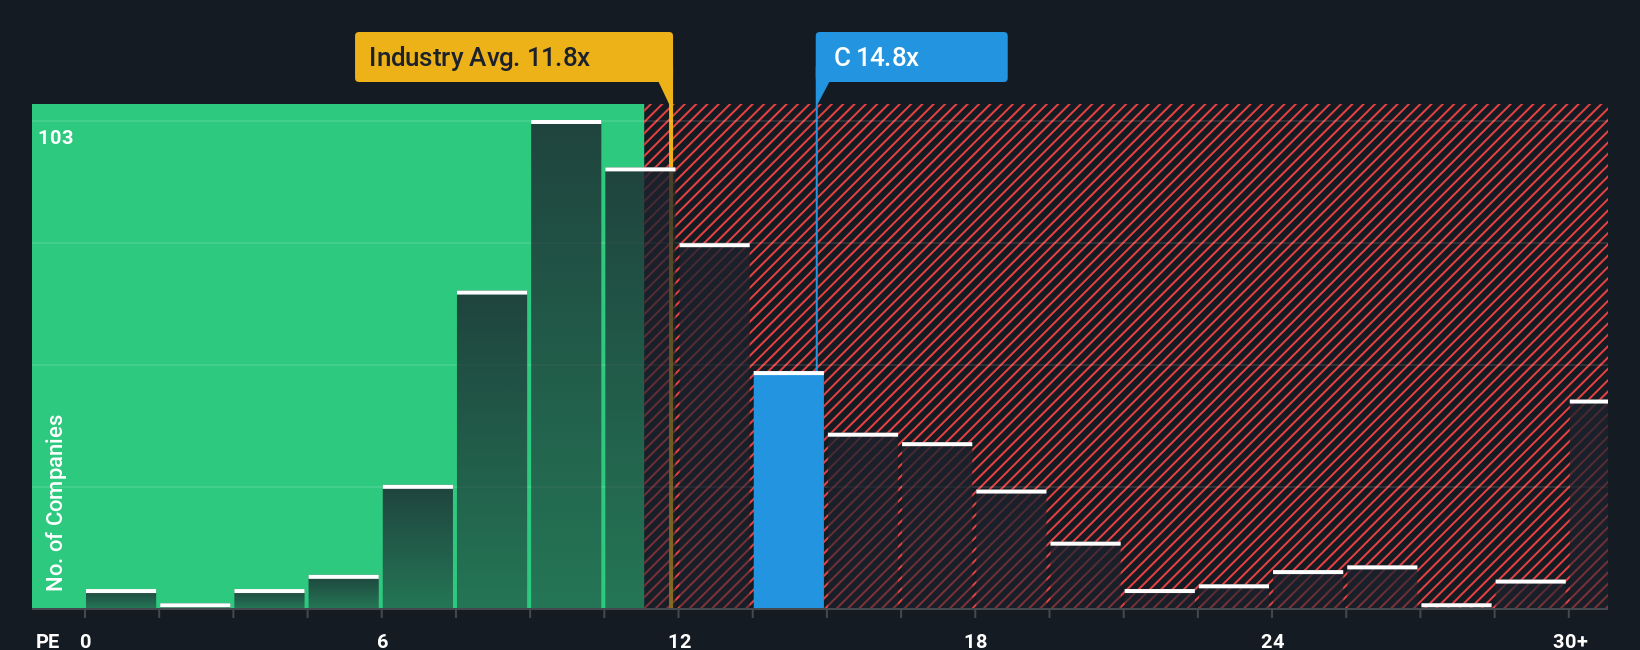
For a profitable bank like Citigroup, the price to earnings, or PE, ratio is a practical way to judge valuation because it links what investors pay today to the earnings the business is already generating. In general, companies with stronger, more reliable growth and lower risk tend to justify higher PE ratios, while slower growing or riskier businesses usually deserve lower multiples.
Citigroup currently trades on a PE of 14.9x, which sits above the broader Banks industry average of about 11.9x but is only slightly above its direct peer group average of 13.6x. Simply Wall St goes a step further by estimating a Fair Ratio of 16.9x. This is a proprietary view of what Citigroup’s PE should be once factors like its earnings growth outlook, profitability, risk profile, industry positioning and market cap are all taken into account. This Fair Ratio is more informative than a simple comparison with peers or the sector because it adjusts for company specific strengths and weaknesses rather than assuming all banks deserve the same multiple.
Since Citigroup’s current PE of 14.9x sits below the Fair Ratio of 16.9x, the stock still screens as attractively priced on this metric.
Result: UNDERVALUED
PE ratios tell one story, but what if the real opportunity lies elsewhere? Discover 1448 companies where insiders are betting big on explosive growth.
Upgrade Your Decision Making: Choose your Citigroup Narrative
Earlier we mentioned that there is an even better way to understand valuation, so let us introduce you to Narratives, a simple way to connect your view of Citigroup’s future to a concrete fair value estimate.
A Narrative is your story behind the numbers, where you spell out how you think Citigroup’s revenue, earnings and margins will evolve and then translate that view into a financial forecast and a fair value per share.
On Simply Wall St, Narratives are easy to build and follow on the Community page, where millions of investors link a company’s story to a set of assumptions, see what that implies for fair value, and compare that to today’s share price to decide whether they think it is a buy, hold or sell.
Because Narratives on the platform update dynamically as new information comes in, such as earnings results, strategic announcements or regulatory changes, your fair value view for Citigroup never has to be static or stale.
For example, one Citigroup Narrative might assume a fair value near $230 based on strong digital asset adoption and high margins. Another might land closer to $114 on more moderate growth and profitability assumptions. Comparing those different stories can help you decide which outlook you believe and how you want to invest around it.
For Citigroup however we'll make it really easy for you with previews of two leading Citigroup Narratives:
Fair value: $233.04
Implied undervaluation vs current price: 52.0%
Forecast revenue growth: 6.0%
- Assumes Citi becomes a leading player in regulated digital assets, using Citi Token Services and a supportive GENIUS Act framework to capture high margin cross border payment flows.
- Core franchises in Services, Markets, Banking, Wealth and U.S. Personal Banking are all growing strongly, driving higher returns on tangible equity and significant excess returns over the cost of capital.
- Management executes on a long term transformation plan, using automation and AI to lower costs, lift RoTCE well above 11%, and support a path to around $230 fair value plus a combined dividend and buyback yield close to 6%.
Fair value: $102.80
Implied overvaluation vs current price: 8.8%
Forecast revenue growth: 8.31%
- Leans on a bullish analyst cohort that expects solid revenue and margin expansion, but still arrives at a fair value below the current share price using an 11.2x PE on 2028 earnings.
- Highlights execution and macro risks including regulatory shifts, geopolitical tension, credit deterioration and weaker global trade that could pressure net interest margins and fee income.
- Suggests investors should only agree with this upside case if they are comfortable that Citi can reach about $91.3 billion in revenue, $20.0 billion in earnings and sustain a premium multiple despite these uncertainties.
Do you think there's more to the story for Citigroup? Head over to our Community to see what others are saying!
This article by Simply Wall St is general in nature. We provide commentary based on historical data and analyst forecasts only using an unbiased methodology and our articles are not intended to be financial advice. It does not constitute a recommendation to buy or sell any stock, and does not take account of your objectives, or your financial situation. We aim to bring you long-term focused analysis driven by fundamental data. Note that our analysis may not factor in the latest price-sensitive company announcements or qualitative material. Simply Wall St has no position in any stocks mentioned.
Have feedback on this article? Concerned about the content? Get in touch with us directly. Alternatively, email editorial-team@simplywallst.com