
Assessing Vertiv’s Valuation After a 1131.2% Three Year Surge in 2025
- If you are wondering whether Vertiv Holdings Co is still a buy after its big run, you are not alone. This breakdown is going to focus squarely on what the current share price really implies about future returns.
- The stock has cooled off recently, down 14.7% over the last week and 7.0% over the past month, but it is still up 36.3% year to date and an eye catching 1131.2% over three years. This naturally raises the question of how much upside might be left versus the risk of a pullback.
- Behind those moves, investors have been reacting to Vertiv's growing role as a key infrastructure provider for data centers and AI related demand, with major hyperscalers and colocation players ramping capex into power and cooling solutions. At the same time, the broader market conversation around data center bottlenecks and grid constraints has spotlighted companies like Vertiv that sit in the middle of these structural upgrades.
- On our framework, Vertiv currently earns a valuation score of 3/6, meaning it screens as undervalued on half of the key checks we run. This makes it a strong candidate to examine through multiple valuation lenses. In the next sections we will walk through those different approaches to see what they are really saying about Vertiv's price today and then finish with an even more powerful way to think about valuation that goes beyond any single model.
Approach 1: Vertiv Holdings Co Discounted Cash Flow (DCF) Analysis
A Discounted Cash Flow model estimates what a company is worth by projecting the cash it can generate in the future and then discounting those cash flows back to today. For Vertiv Holdings Co, this two stage Free Cash Flow to Equity model starts from last twelve months free cash flow of about $1.36 billion and then applies analyst estimates and longer term growth assumptions.
Analysts see free cash flow climbing to around $1.80 billion in 2026 and $2.89 billion by 2028, with Simply Wall St extrapolating that out to roughly $7.56 billion in 2035 as the data center and AI infrastructure cycle matures. These growing cash flows are then discounted to reflect risk and the time value of money, and summed to arrive at an estimated intrinsic value of $215.17 per share.
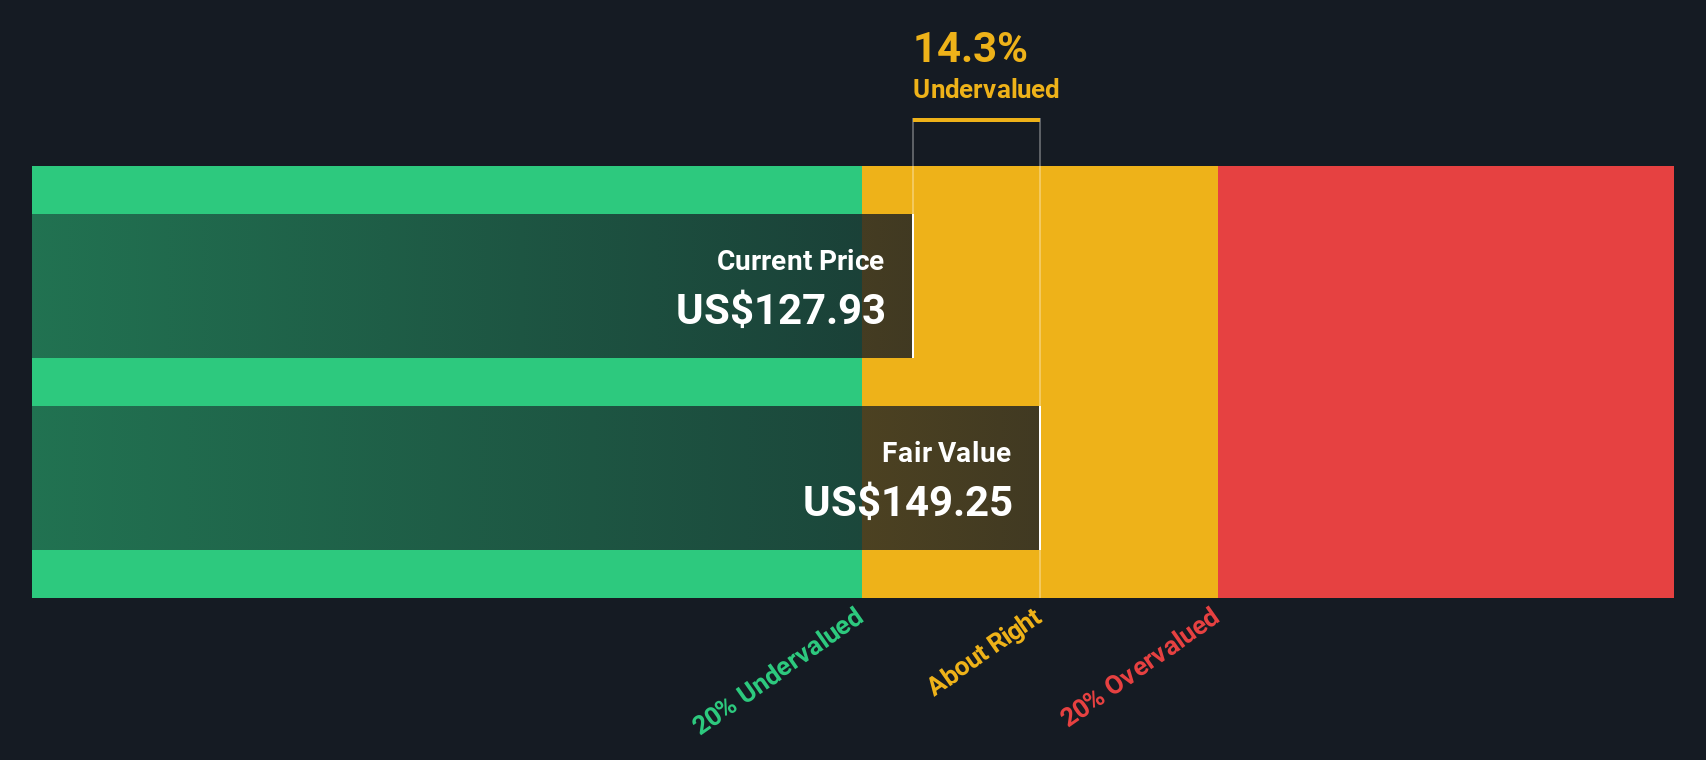
Compared with the current share price, this implies the stock is trading at roughly a 25.0% discount to its modeled fair value, which indicates that it may be undervalued if the cash flow trajectory develops as outlined.
Result: UNDERVALUED
Our Discounted Cash Flow (DCF) analysis suggests Vertiv Holdings Co is undervalued by 25.0%. Track this in your watchlist or portfolio, or discover 907 more undervalued stocks based on cash flows.
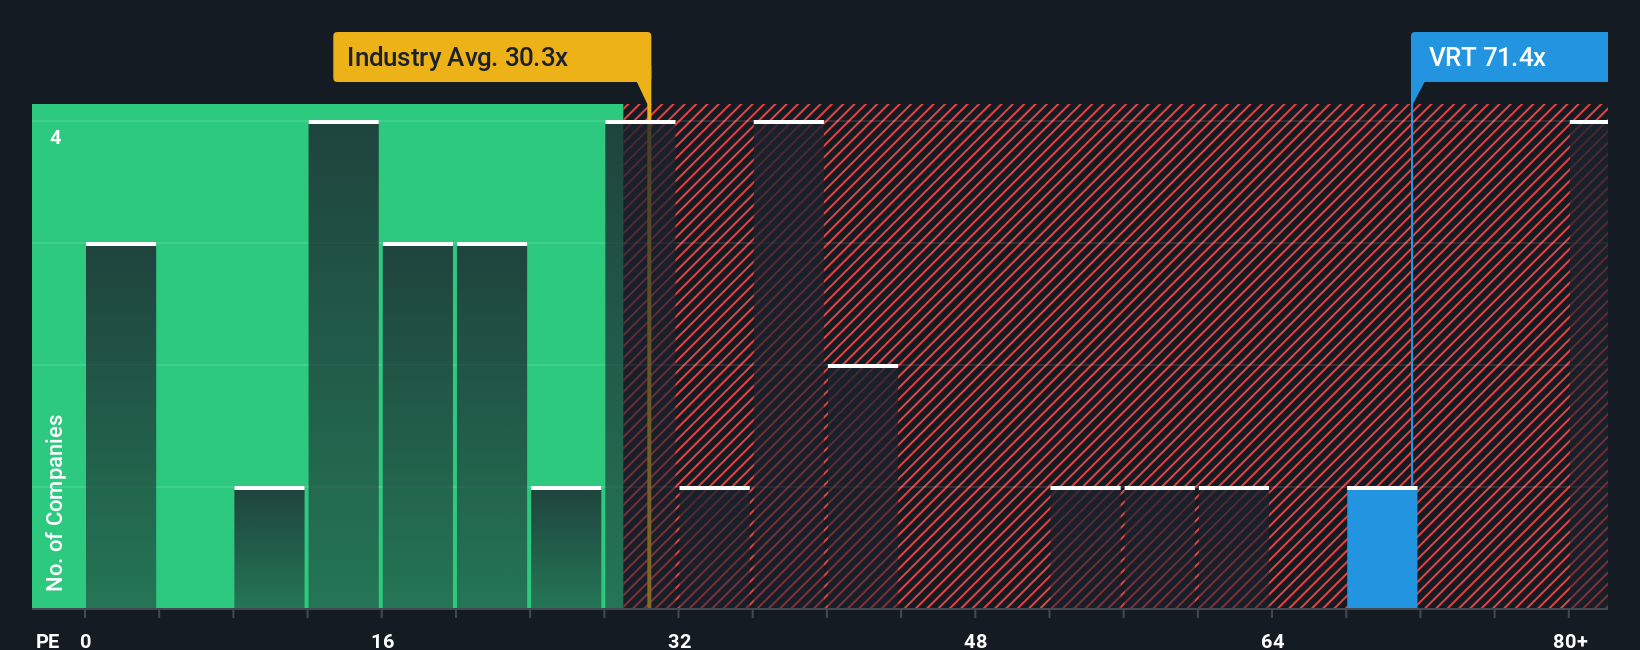
Approach 2: Vertiv Holdings Co Price vs Earnings
For profitable companies like Vertiv, the price to earnings ratio is a straightforward way to gauge how much investors are willing to pay today for each dollar of current earnings. In general, faster growth and lower risk justify a higher PE multiple, while slower or more volatile earnings typically deserve a lower one.
Vertiv currently trades on a PE of about 59.6x, which is well above both the Electrical industry average of roughly 31.6x and the peer group average of around 37.6x. On the surface, that gap suggests the stock carries a substantial growth premium compared to its sector and closest comparables.
Simply Wall St’s Fair Ratio for Vertiv is 58.4x, a proprietary estimate of the PE you would expect given its earnings growth profile, margins, risk factors, industry, and market cap. This makes it more useful than a simple peer or industry comparison because it adjusts for Vertiv’s specific strengths and vulnerabilities rather than assuming all companies deserve the same multiple. With the current PE only slightly above the Fair Ratio, the valuation looks roughly in line with what its fundamentals warrant.
Result: ABOUT RIGHT
PE ratios tell one story, but what if the real opportunity lies elsewhere? Discover 1448 companies where insiders are betting big on explosive growth.
Upgrade Your Decision Making: Choose your Vertiv Holdings Co Narrative
Earlier we mentioned that there is an even better way to understand valuation, so let's introduce you to Narratives, a simple way to connect your view of Vertiv's business with a concrete financial forecast and a Fair Value estimate you can compare to today's share price.
A Narrative is your story for the company, where you spell out what you think will happen to revenue, earnings, and margins, and those assumptions flow directly into a forecast and a Fair Value number rather than sitting as vague opinions beside the data.
On Simply Wall St's Community page, used by millions of investors, you can choose or create a Vertiv Narrative that matches your perspective and instantly see whether your Fair Value suggests the stock is a buy, a hold, or a sell at the current price, with that view updating dynamically as new earnings, news, or guidance arrive.
For example, one Vertiv Narrative might assume rapid AI driven demand, rising margins and a Fair Value near the higher analyst target of about $173. In contrast, a more cautious Narrative could factor in competitive and execution risks to arrive closer to the low end near $119. This can help each investor decide whether today's price of roughly $125.58 offers enough upside for their preferred story.
Do you think there's more to the story for Vertiv Holdings Co? Head over to our Community to see what others are saying!

This article by Simply Wall St is general in nature. We provide commentary based on historical data and analyst forecasts only using an unbiased methodology and our articles are not intended to be financial advice. It does not constitute a recommendation to buy or sell any stock, and does not take account of your objectives, or your financial situation. We aim to bring you long-term focused analysis driven by fundamental data. Note that our analysis may not factor in the latest price-sensitive company announcements or qualitative material. Simply Wall St has no position in any stocks mentioned.
Have feedback on this article? Concerned about the content? Get in touch with us directly. Alternatively, email editorial-team@simplywallst.com