
Has Uber’s Surge Since 2022 Left Enough Upside for Investors in 2025?
- If you are wondering whether Uber Technologies remains a smart buy after its huge run, or whether the easy money has already been made, this is the right place to unpack what the market is really pricing in.
- Despite a recent pullback, with the stock down 6.8% over the last week and 9.0% over the past month, Uber is still up 34.7% year to date and 42.0% over the last year, with a 227.7% gain over three years.
- Much of this move has been associated with growing confidence in Uber's ability to translate its ride hailing and delivery platforms into durable, profitable growth, as investors increasingly frame it as a scaled logistics and mobility network rather than a cash-burning startup. Ongoing headlines about regulatory shifts, competitive dynamics in food delivery, and expansion into new services have all fed into changing expectations about risk, growth, and what the business could be worth over the long term.
- Right now, Uber scores a 6/6 on our valuation checks, which suggests the market may still be underestimating it. To understand that score in more detail, we will walk through different valuation approaches and then finish with another way to think about what Uber may be worth.
Approach 1: Uber Technologies Discounted Cash Flow (DCF) Analysis
A Discounted Cash Flow model estimates what a business is worth by projecting its future cash flows and discounting them back to today in $ terms. For Uber Technologies, the model used is a 2 Stage Free Cash Flow to Equity approach, starting from last twelve months free cash flow of about $8.7 billion.
Analysts expect free cash flow to keep rising, with projections climbing to roughly $16.5 billion by 2029. Simply Wall St extrapolates this trend further out to 2035 using gradually slowing growth assumptions. These long term forecasts are then discounted back to present value to reflect risk and the time value of money.
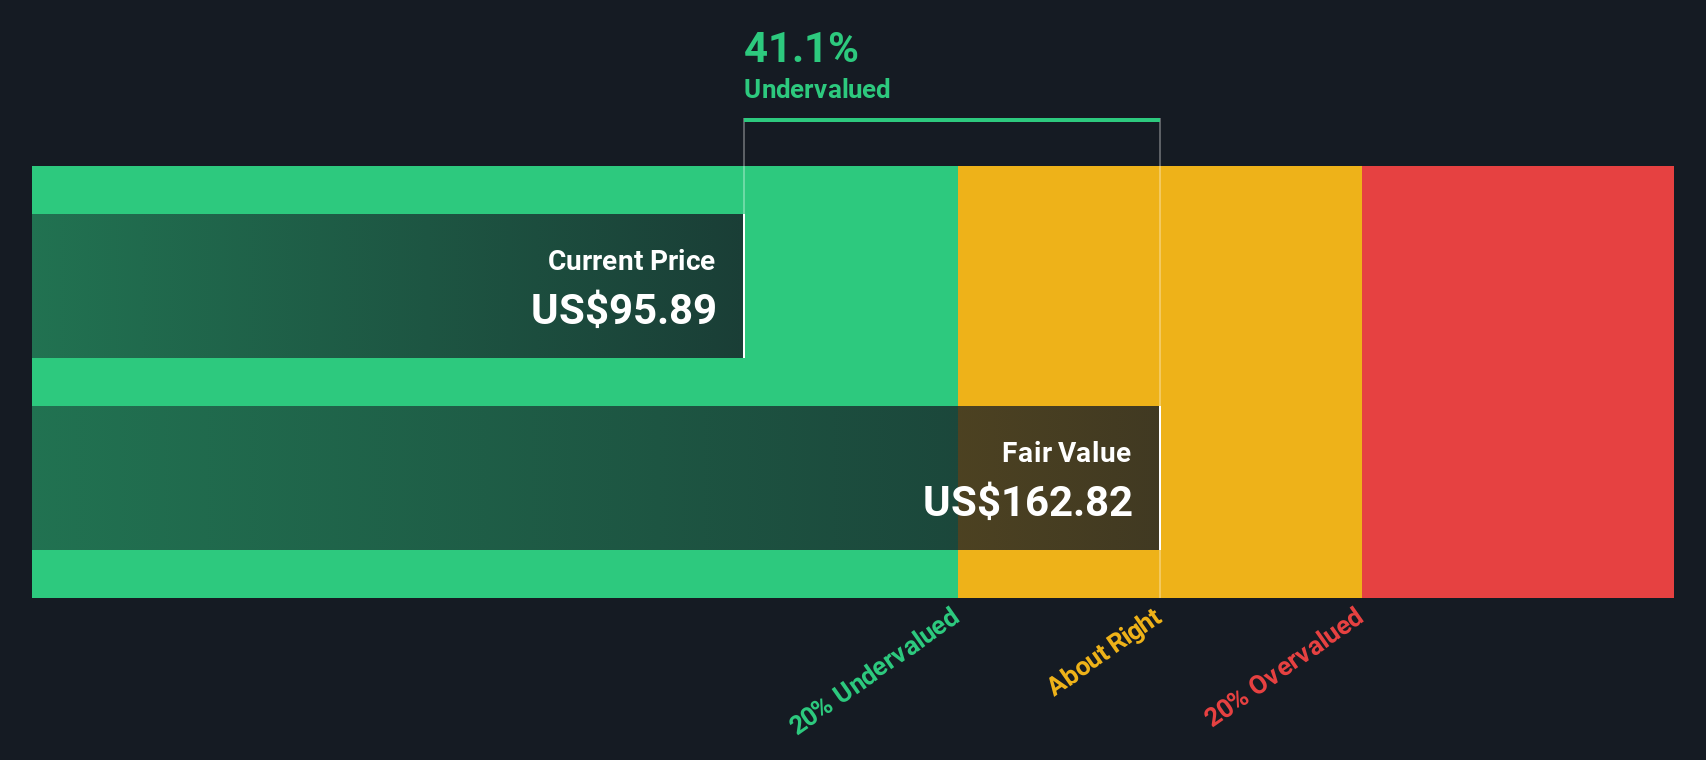
On this basis, the DCF model arrives at an intrinsic value of about $167.02 per share. Compared with the current market price, this implies the stock trades at roughly a 49.0% discount, which indicates that investors are still skeptical about how durable Uber's cash generation will be.
Result: UNDERVALUED
Our Discounted Cash Flow (DCF) analysis suggests Uber Technologies is undervalued by 49.0%. Track this in your watchlist or portfolio, or discover 907 more undervalued stocks based on cash flows.
Approach 2: Uber Technologies Price vs Earnings
For profitable companies like Uber, the price to earnings ratio is a useful way to gauge how much investors are willing to pay today for each dollar of current earnings. A higher PE can be justified when a business is growing quickly and its earnings are seen as relatively predictable, while slower growth or higher risk usually calls for a lower, more conservative multiple.
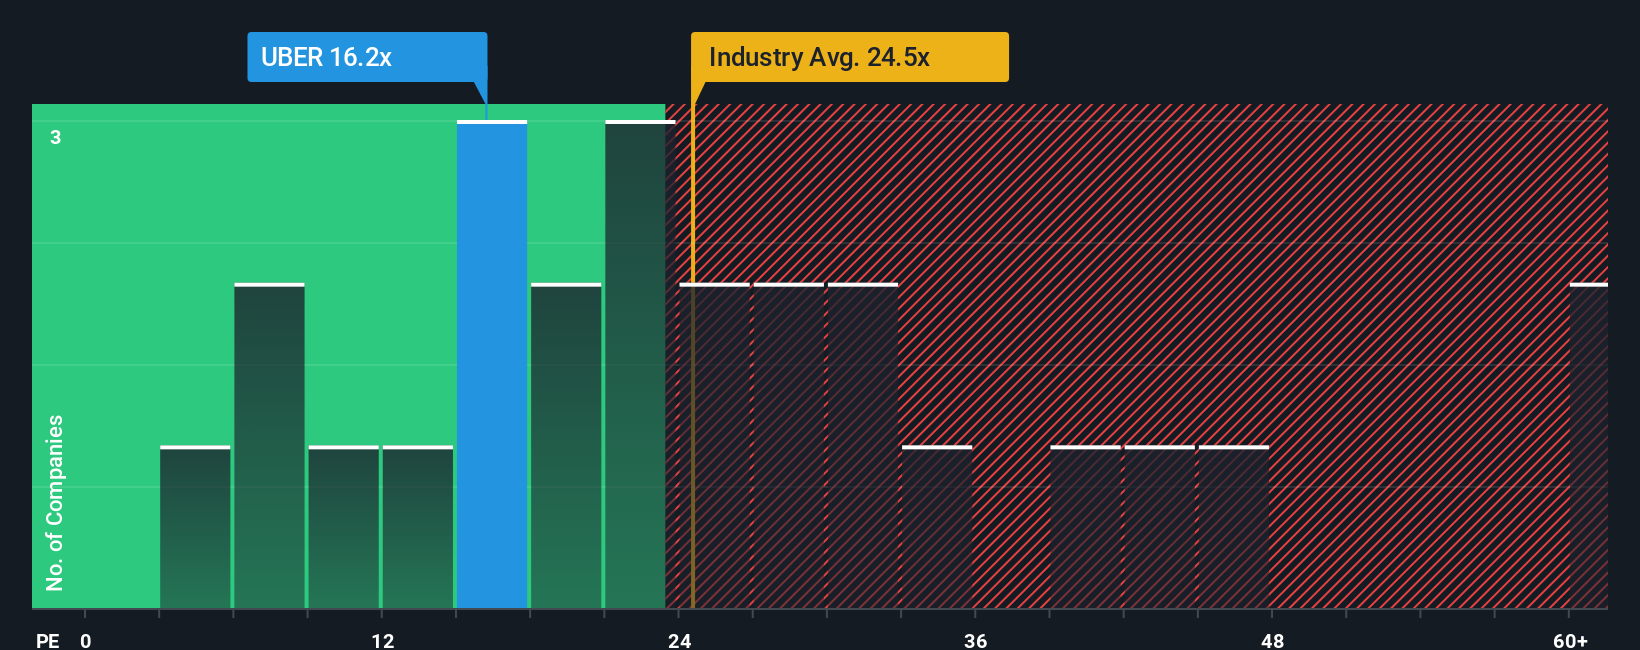
Uber currently trades on a PE of about 10.6x. That is well below the Transportation industry average of roughly 32.3x and also far under the 67.7x average of its higher growth peers. This implies the market is still applying a discount despite Uber’s improving profitability and scale. To cut through these broad comparisons, Simply Wall St uses a proprietary “Fair Ratio” framework that estimates what PE multiple a company should trade on given its specific earnings growth outlook, margins, industry, market cap and risk profile.
Uber’s Fair Ratio is 14.2x, modestly above the current 10.6x. This suggests that if the company delivers on its growth and maintains profitability, there is still room for the market to re rate the stock higher over time.
Result: UNDERVALUED
PE ratios tell one story, but what if the real opportunity lies elsewhere? Discover 1448 companies where insiders are betting big on explosive growth.
Upgrade Your Decision Making: Choose your Uber Technologies Narrative
Earlier we mentioned that there is an even better way to understand valuation, so let us introduce you to Narratives, a simple framework on Simply Wall St’s Community page that lets you attach a clear story to your numbers by setting your own assumptions for Uber’s future revenue, earnings and margins. This turns your inputs into a financial forecast and then into a Fair Value you can compare directly with today’s share price to decide whether it is a buy, hold or sell. The whole view updates automatically as fresh news, earnings and regulatory developments come in. For Uber, you might see one Narrative that assumes slower growth, margin pressure from autonomous vehicles and a Fair Value near $75 per share. Another Narrative might expect sustained platform growth, improving engagement economics and durable advantages from autonomy, and assign a Fair Value closer to $111. This illustrates how different but clearly defined perspectives can coexist and helps you choose which story, and price, you actually believe.
For Uber Technologies however we will make it really easy for you with previews of two leading Uber Technologies Narratives:
Fair value: $111.06 per share
Implied undervaluation vs last close: approximately 23.4%
Forecast revenue growth: 14.59% per year
- Views Uber as a scaled, multi modal platform where cross selling between Mobility, Delivery and new verticals drives higher engagement, revenue per user and improving net margins.
- Expects long term upside from autonomous vehicles, electrification and high margin ancillary streams such as advertising and Uber One membership to support durable earnings power.
- Sees regulatory, competitive and execution risks as manageable, with analysts targeting around $106 to $150 per share and a 2028 PE multiple near 27.8x on earnings of roughly $9.7 billion.
Fair value: $75.00 per share
Implied overvaluation vs last close: approximately 13.4%
Forecast revenue growth: 4.2% per year
- Argues that while revenue and profitability momentum are strong today, the current market cap of about $192 billion already prices in overly optimistic long term assumptions.
- Projects 2030 revenue of $65 to $70 billion and EBITDA of $14 to $15 billion, implying a fair value market cap range of $90 to $135 billion that is well below today’s level.
- Concludes that the risk reward is unattractive above the current price and suggests a more cautious entry range of $65 to $75 per share even after factoring in autonomous vehicle benefits.
Do you think there's more to the story for Uber Technologies? Head over to our Community to see what others are saying!

This article by Simply Wall St is general in nature. We provide commentary based on historical data and analyst forecasts only using an unbiased methodology and our articles are not intended to be financial advice. It does not constitute a recommendation to buy or sell any stock, and does not take account of your objectives, or your financial situation. We aim to bring you long-term focused analysis driven by fundamental data. Note that our analysis may not factor in the latest price-sensitive company announcements or qualitative material. Simply Wall St has no position in any stocks mentioned.
Have feedback on this article? Concerned about the content? Get in touch with us directly. Alternatively, email editorial-team@simplywallst.com