
Does Synopsys Still Offer Value After Its Recent AI Driven Share Price Surge?
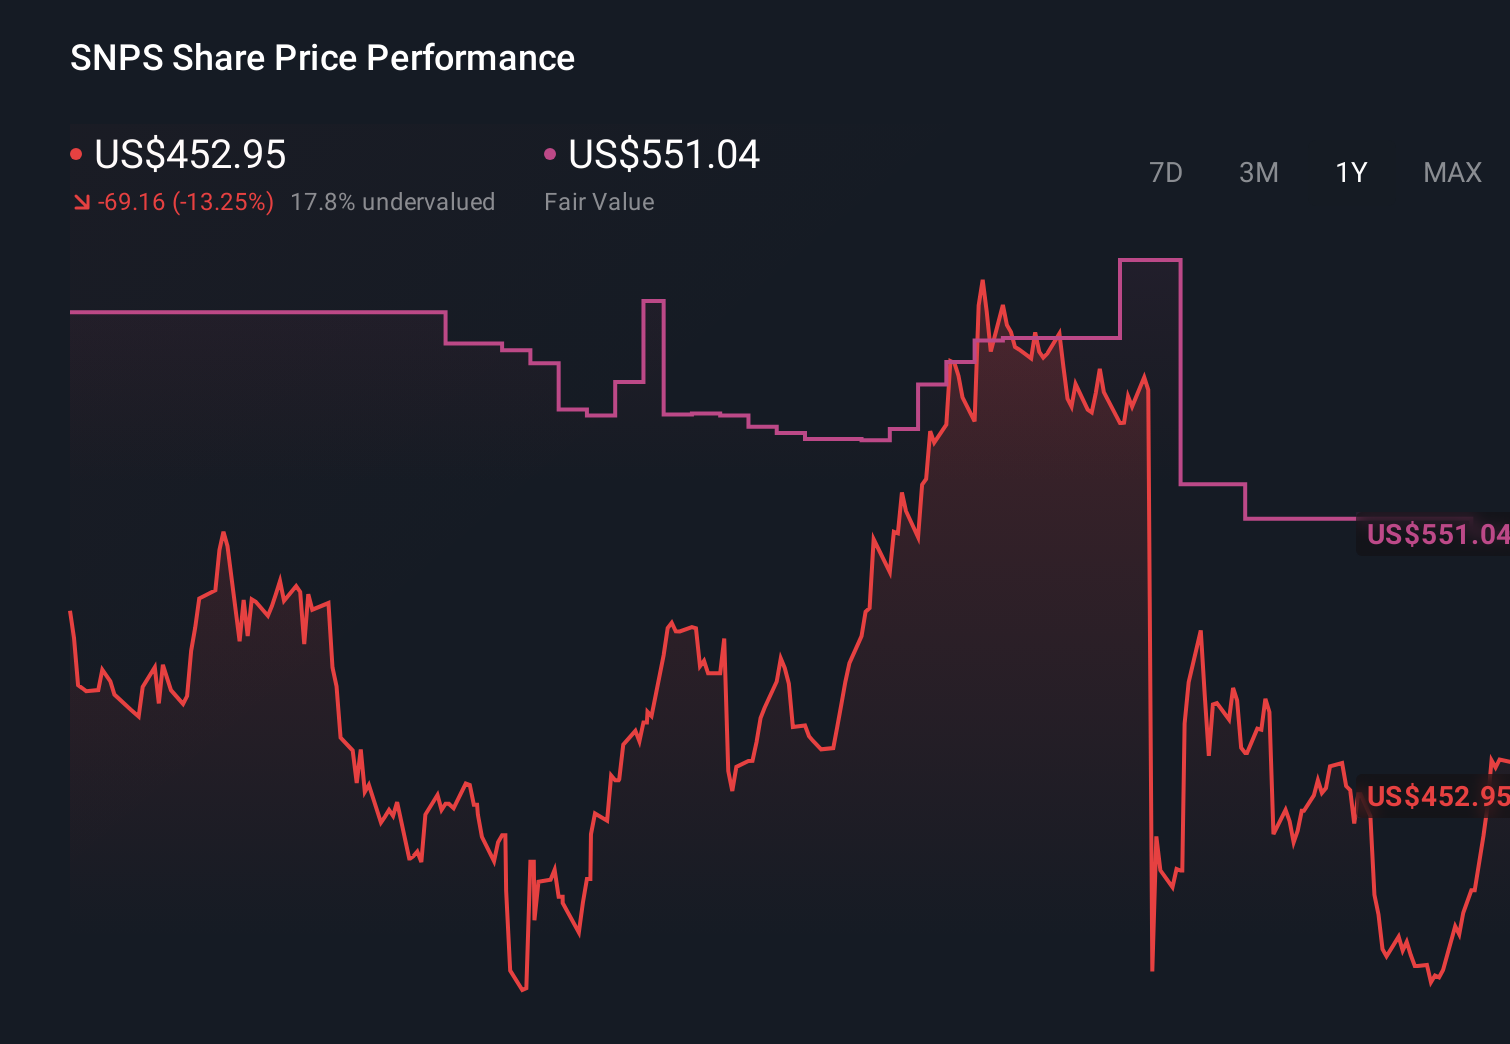
- Wondering if Synopsys at around $452 a share is still a smart buy or if the easy money has already been made? Let us unpack what the current market price may be missing about its long term value.
- The stock has slipped about 3% over the last week, but that comes after a strong 15% run in the past month, leaving shares still down 6.2% year to date and 10.9% over the last year while longer term holders sit on gains of 37.6% over 3 years and 77.6% over 5 years.
- Recent headlines around Synopsys have centered on its role at the heart of the semiconductor and AI design ecosystem, with investors watching closely as chipmakers lean ever more heavily on its tools and IP to push the next wave of innovation. At the same time, regulatory attention on large tech deals and ongoing shifts in AI infrastructure spending are shaping sentiment about how durable Synopsys growth runway really is.
- Right now, Synopsys scores a 2 out of 6 valuation checks. This suggests the market may already be pricing in a lot of good news, but not necessarily all of it in the same way across different models. Next, we will dig into discounted cash flow, multiples and other approaches to see what they imply for fair value, before finishing with a more practical way to think about Synopsys valuation that goes beyond any single metric.
Synopsys scores just 2/6 on our valuation checks. See what other red flags we found in the full valuation breakdown.
Approach 1: Synopsys Discounted Cash Flow (DCF) Analysis
A Discounted Cash Flow model estimates what a business is worth today by projecting its future cash flows and then discounting those back to a present value. For Synopsys, the model starts with last twelve month free cash flow of about $1.33 billion and builds a two stage forecast of how that cash generation could grow over time.
Analysts provide detailed free cash flow estimates out to 2029, with Simply Wall St extrapolating the later years. Under this framework, annual free cash flow is projected to reach roughly $4.87 billion by 2030, with further growth thereafter as the company scales its software and IP platform. All of these future cash flows are discounted back using an appropriate rate to reflect risk and the time value of money.
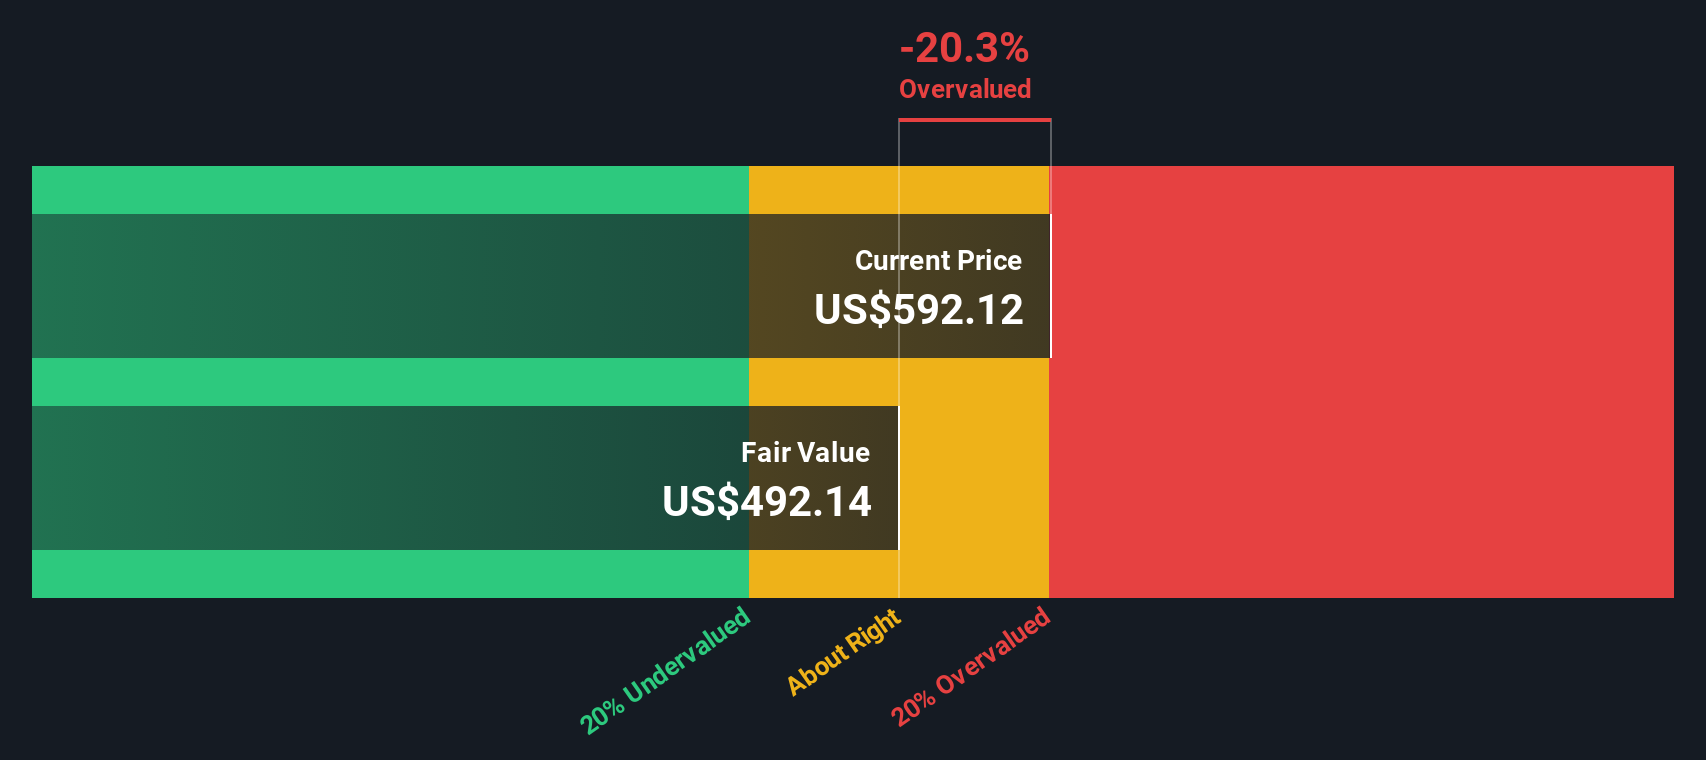
Putting the projections together, the DCF model arrives at an intrinsic value of about $460.32 per share, implying Synopsys is trading at roughly a 1.6% discount to fair value. That is within the margin of error, so it points to a stock that is broadly fairly priced rather than a major bargain.
Result: ABOUT RIGHT
Synopsys is fairly valued according to our Discounted Cash Flow (DCF), but this can change at a moment's notice. Track the value in your watchlist or portfolio and be alerted on when to act.
Approach 2: Synopsys Price vs Earnings
For profitable, established software businesses like Synopsys, the price to earnings ratio is a useful shorthand for how much investors are willing to pay today for each dollar of current earnings. It captures both what the company is earning now and what the market expects those earnings to look like in the future.
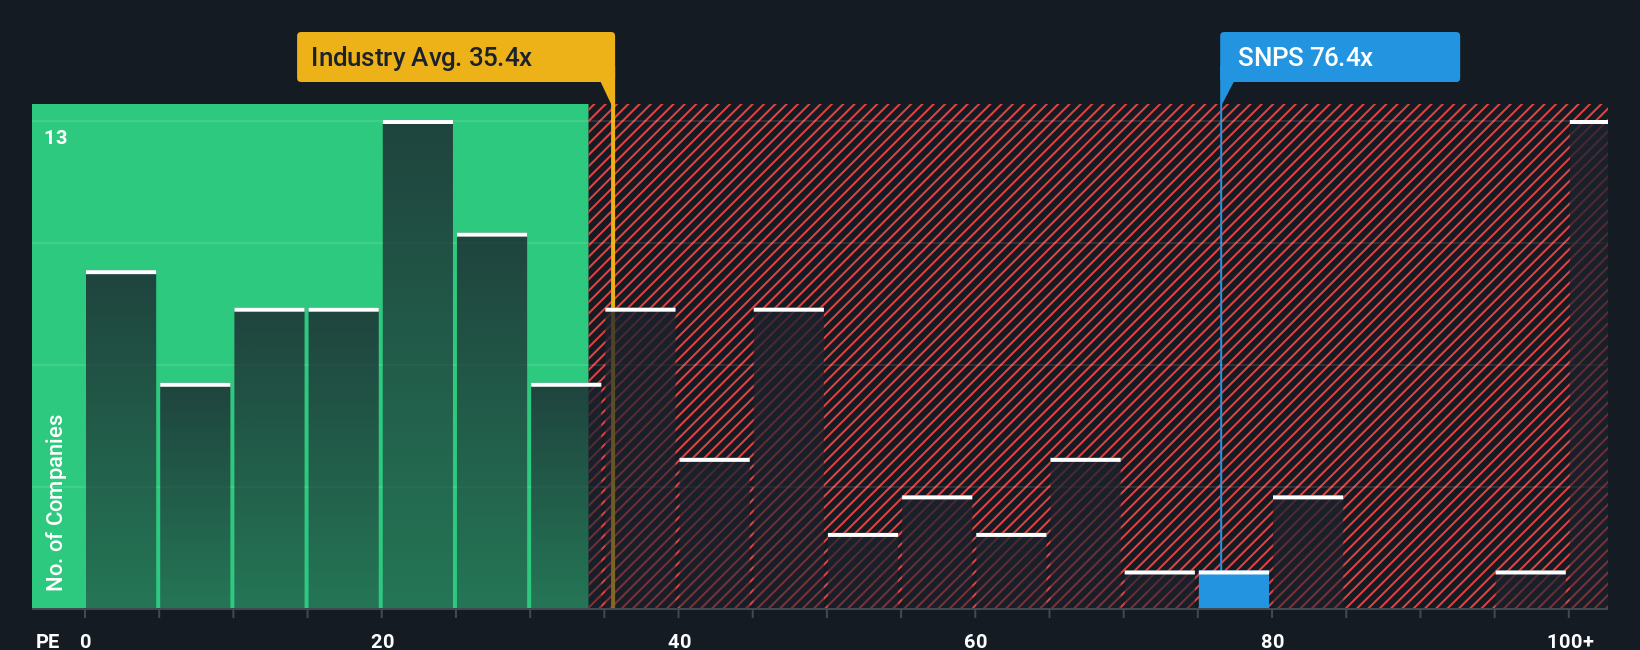
In general, faster growth and lower perceived risk justify a higher, or more expensive, PE multiple, while slower growth or higher uncertainty should lead to a lower, cheaper PE. Synopsys currently trades on about 64.7x earnings, which is roughly in line with its direct peer average of 63.1x, but well above the broader software industry average of 32.9x. At first glance, that suggests the market is already assigning Synopsys a premium valuation.
Simply Wall St also calculates a Fair Ratio of 40.6x, which is the PE multiple Synopsys might reasonably command given its earnings growth outlook, margins, industry, size and risk profile. Because this Fair Ratio is tailored to the company, it is more informative than a simple comparison with peers or the wider industry. With the actual PE multiple of 64.7x sitting materially above the Fair Ratio, Synopsys screens as expensive on an earnings basis.
Result: OVERVALUED
PE ratios tell one story, but what if the real opportunity lies elsewhere? Discover 1448 companies where insiders are betting big on explosive growth.
Upgrade Your Decision Making: Choose your Synopsys Narrative
Earlier we mentioned that there is an even better way to understand valuation, so let us introduce you to Narratives, a simple way to connect your view of Synopsys business to a financial forecast and then to a fair value estimate that you can actually act on. A Narrative is your story behind the numbers, where you decide what you believe about Synopsys future revenue, earnings and margins, and those assumptions are turned into a forecast and a fair value that you can compare with today’s share price to decide whether it looks like a buy, hold or sell. Narratives are available on Simply Wall St’s Community page, and they are designed to be easy and accessible, updating automatically as new information like earnings reports, regulatory news or major customer developments come through. For Synopsys, for example, one investor might build a Narrative that reflects optimism about strong AI driven demand and margin expansion, which could lead them to view a fair value closer to the upper analyst target range near $715. A more cautious investor could focus on IP headwinds and China risk, which might lead them to view a fair value nearer the low end around $550.
Do you think there's more to the story for Synopsys? Head over to our Community to see what others are saying!
This article by Simply Wall St is general in nature. We provide commentary based on historical data and analyst forecasts only using an unbiased methodology and our articles are not intended to be financial advice. It does not constitute a recommendation to buy or sell any stock, and does not take account of your objectives, or your financial situation. We aim to bring you long-term focused analysis driven by fundamental data. Note that our analysis may not factor in the latest price-sensitive company announcements or qualitative material. Simply Wall St has no position in any stocks mentioned.
Have feedback on this article? Concerned about the content? Get in touch with us directly. Alternatively, email editorial-team@simplywallst.com