
Is PPL Still Attractive After Recent Share Pullback and Mixed Valuation Signals?
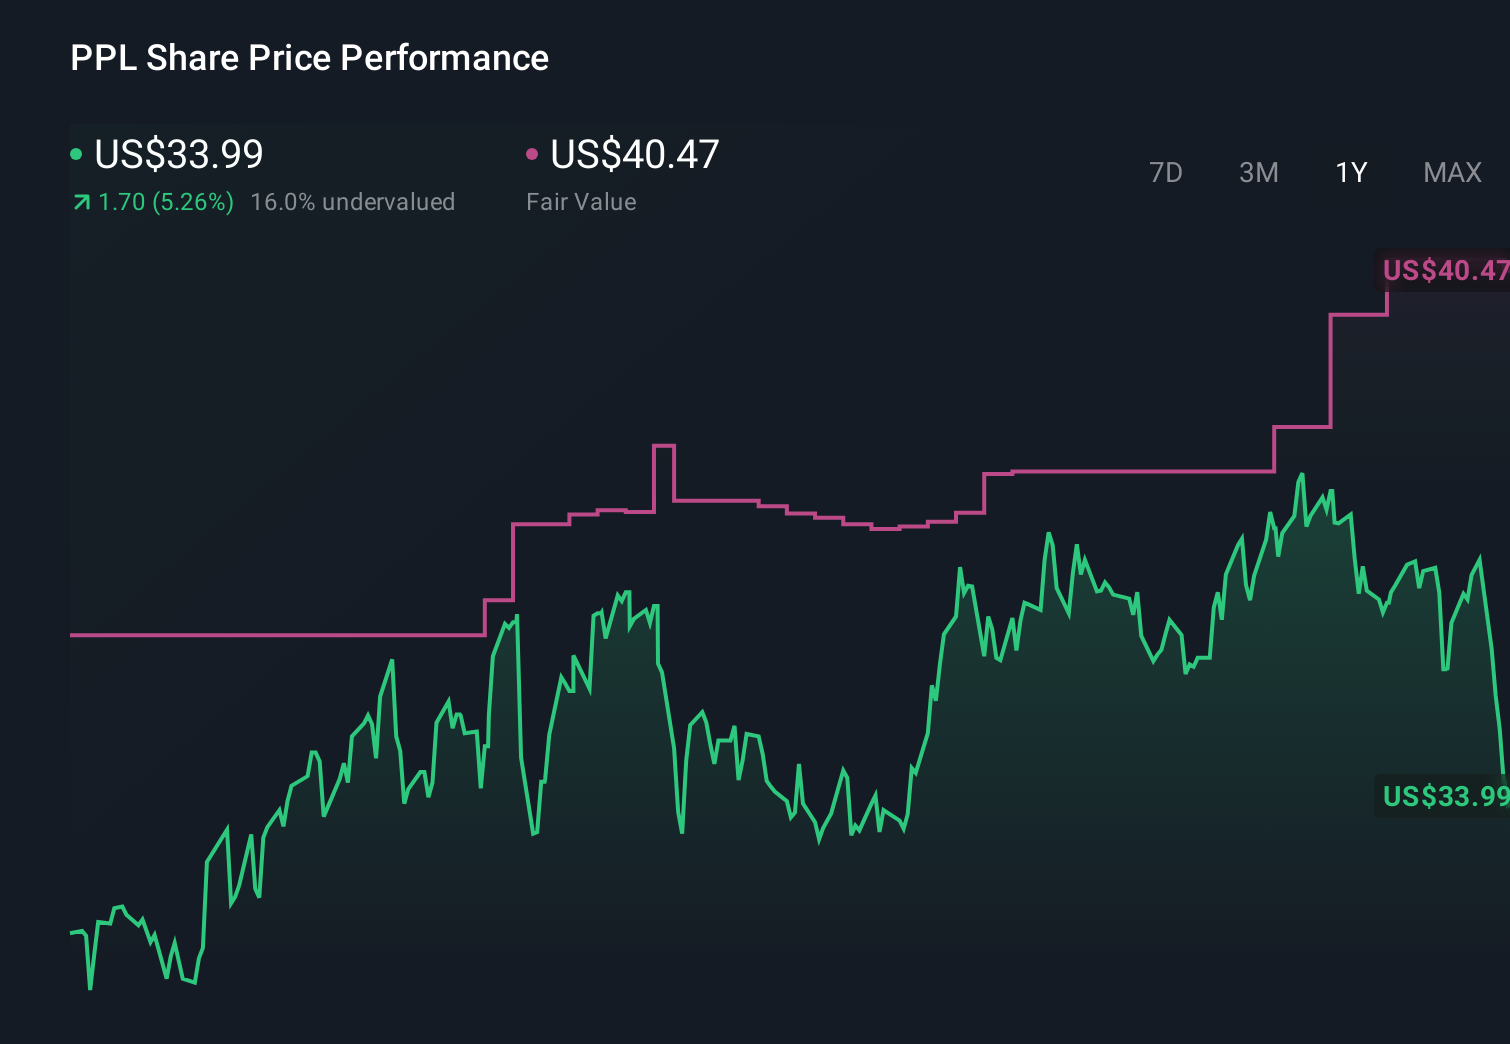
- Wondering if PPL at around $33.99 is quietly becoming a value opportunity, or if the easy money has already been made? You are not alone, as many investors are asking the same question.
- Over the last week the stock has inched up 0.4%, but that comes after a 7.8% slide over 30 days that still leaves it up 5.6% year to date and 8.7% over the past year, with longer term gains of 29.4% over 3 years and 52.9% over 5 years.
- These swings have come as investors reassess regulated utilities like PPL in light of shifting interest rate expectations and renewed focus on grid reliability and energy transition spending. Sector wide news about infrastructure upgrades, regulatory frameworks and capital investment plans has kept sentiment in flux, putting extra attention on which utilities are genuinely undervalued versus just stable.
- Right now PPL only scores a 1/6 valuation check score, suggesting that by our usual yardstick it does not scream bargain, but different valuation methods can tell very different stories. We will finish by looking at an even smarter way to think about what the market might be missing.
PPL scores just 1/6 on our valuation checks. See what other red flags we found in the full valuation breakdown.
Approach 1: PPL Discounted Cash Flow (DCF) Analysis
A Discounted Cash Flow model estimates what a business is worth today by projecting the cash it can generate in the future and then discounting those cash flows back to a present value in $.
For PPL, the latest twelve month free cash flow is negative at around $0.43 billion, reflecting heavy investment in its networks. Analysts and extrapolations used in this 2 Stage Free Cash Flow to Equity model see cash flow improving to roughly $1.49 billion by 2028, before tapering off to about $0.76 billion by 2035 as growth normalizes. Simply Wall St uses explicit analyst forecasts for the first few years, then extends the trend to build a 10 year cash flow path.
When these projected cash flows are discounted back, the model arrives at an intrinsic value of about $26.95 per share, compared with a market price near $33.99. In this model, PPL appears to be roughly 26.1% above its estimated intrinsic value on this cash flow view, which indicates the market price embeds expectations of steadier growth and regulated returns.
Result: OVERVALUED
Our Discounted Cash Flow (DCF) analysis suggests PPL may be overvalued by 26.1%. Discover 907 undervalued stocks or create your own screener to find better value opportunities.
Approach 2: PPL Price vs Earnings
For profitable utilities like PPL, the price to earnings ratio is a useful yardstick because it links what investors pay directly to the profits the business generates today. In general, faster earnings growth and lower perceived risk justify a higher PE multiple, while slower growth or higher uncertainty call for a lower, more cautious multiple.
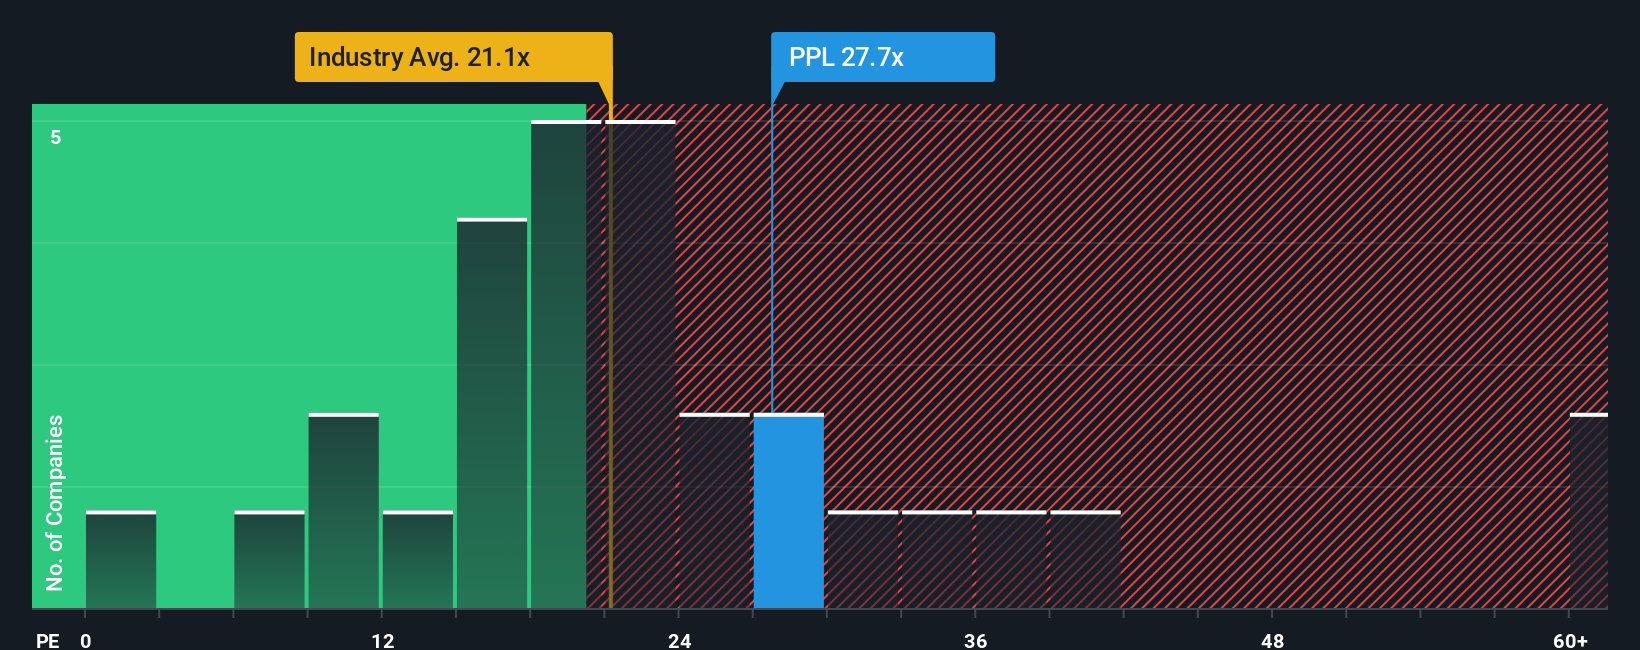
PPL currently trades at about 23.07x earnings, which is above the Electric Utilities industry average of roughly 20.00x and higher than the peer group average of around 14.67x. On the surface that suggests the market is already assigning PPL a premium for its profile. However, Simply Wall St also calculates a proprietary Fair Ratio of about 24.23x for PPL, which reflects its specific earnings growth outlook, profit margins, industry positioning, market cap and risk factors.
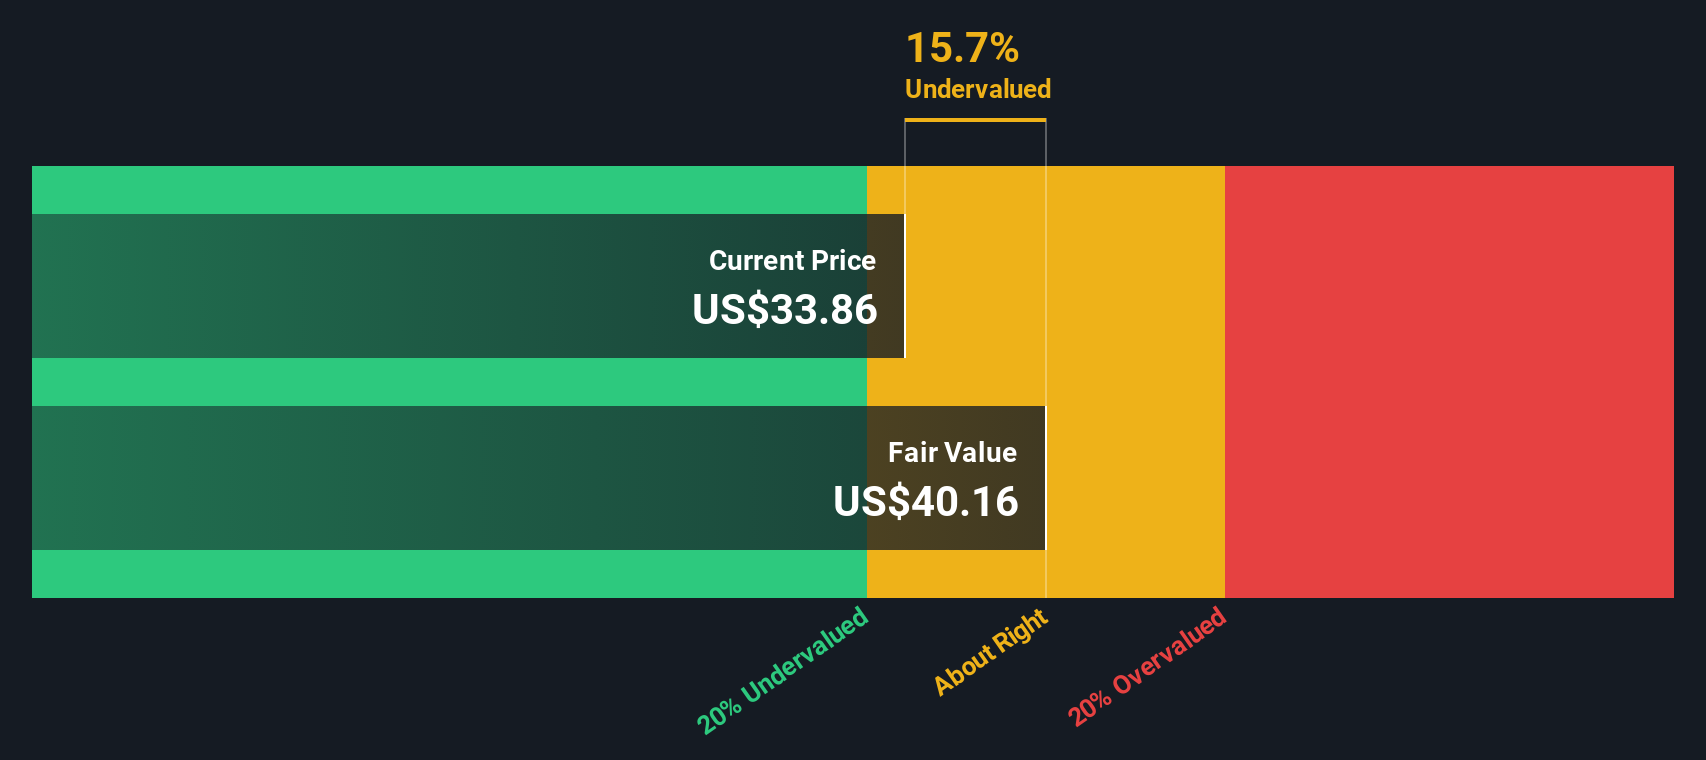
This Fair Ratio is more tailored than a simple comparison with peers or the sector, because it adjusts for company specific strengths and weaknesses rather than assuming all utilities deserve the same multiple. With PPL’s actual PE only slightly below its Fair Ratio, the stock looks modestly undervalued on this earnings based view, though not dramatically so.
Result: UNDERVALUED
PE ratios tell one story, but what if the real opportunity lies elsewhere? Discover 1448 companies where insiders are betting big on explosive growth.
Upgrade Your Decision Making: Choose your PPL Narrative
Earlier we mentioned that there is an even better way to understand valuation, so let us introduce you to Narratives, a simple tool on Simply Wall St’s Community page that lets you attach a clear story to your numbers. It connects your view of PPL’s future revenues, earnings and margins to a forecast and then a Fair Value you can compare with today’s price to decide whether to buy, hold or sell. Each Narrative updates dynamically as new news or earnings arrive. For example, one PPL investor might build a bullish Narrative around accelerating data center driven demand, rising margins toward the high teens and a Fair Value closer to $42. Another might take a more cautious view on regulatory risk and load growth, bake in slower earnings, a lower multiple and a Fair Value nearer $34. Both are valid, transparent perspectives that you can understand, stress test and compare at a glance.
Do you think there's more to the story for PPL? Head over to our Community to see what others are saying!
This article by Simply Wall St is general in nature. We provide commentary based on historical data and analyst forecasts only using an unbiased methodology and our articles are not intended to be financial advice. It does not constitute a recommendation to buy or sell any stock, and does not take account of your objectives, or your financial situation. We aim to bring you long-term focused analysis driven by fundamental data. Note that our analysis may not factor in the latest price-sensitive company announcements or qualitative material. Simply Wall St has no position in any stocks mentioned.
Have feedback on this article? Concerned about the content? Get in touch with us directly. Alternatively, email editorial-team@simplywallst.com