
Is Roku’s Surge in 2025 Still Justified After Advertising and Partnership Momentum?
- If you have ever wondered whether Roku is still a bargain or if most of the upside is already priced in, this breakdown is for you.
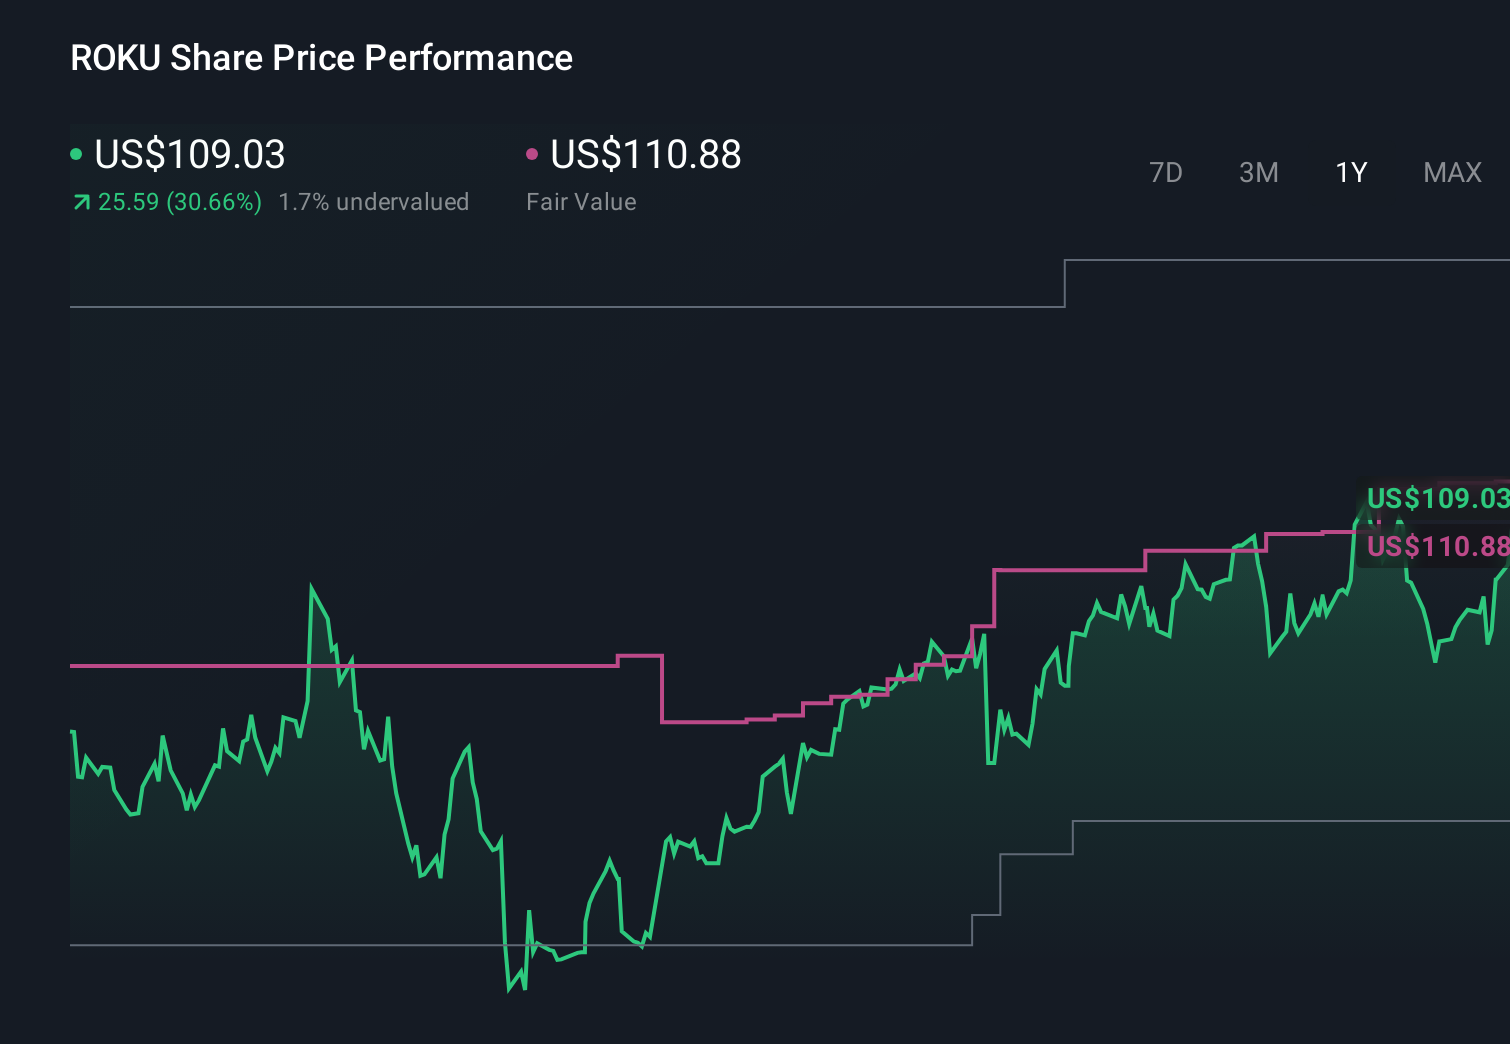
- After a bumpy few years, Roku shares are up 7.4% over the last week, 7.5% over the last month, 44.3% year to date, and 29.5% over the last year, even though the 5-year return is still down 68.5% from earlier peaks.
- Recently, investors have been digesting a mix of headlines around Roku's advertising momentum and its expanding content and distribution partnerships. Together, these help explain the renewed optimism in the share price. At the same time, broader streaming and ad tech sector sentiment has swung more positive, lifting perceived growth potential but also raising questions about how much future success is already reflected in the current valuation.
- On our scorecard, Roku currently earns a valuation score of 3/6, suggesting it looks undervalued on some measures but not others. In the sections that follow, we unpack those different valuation approaches before finishing with a more holistic way to think about what Roku might really be worth.
Approach 1: Roku Discounted Cash Flow (DCF) Analysis
A Discounted Cash Flow model estimates what a business is worth by projecting the cash it can generate in the future, then discounting those cash flows back to a single value in today’s dollars.
For Roku, the latest twelve month Free Cash Flow is about $394.9 Million. Analysts and extrapolated estimates see this rising steadily, with free cash flow expected to reach roughly $2.1 Billion by 2035, based on a 2 Stage Free Cash Flow to Equity model that blends analyst forecasts through 2029 with more moderate growth assumptions thereafter.
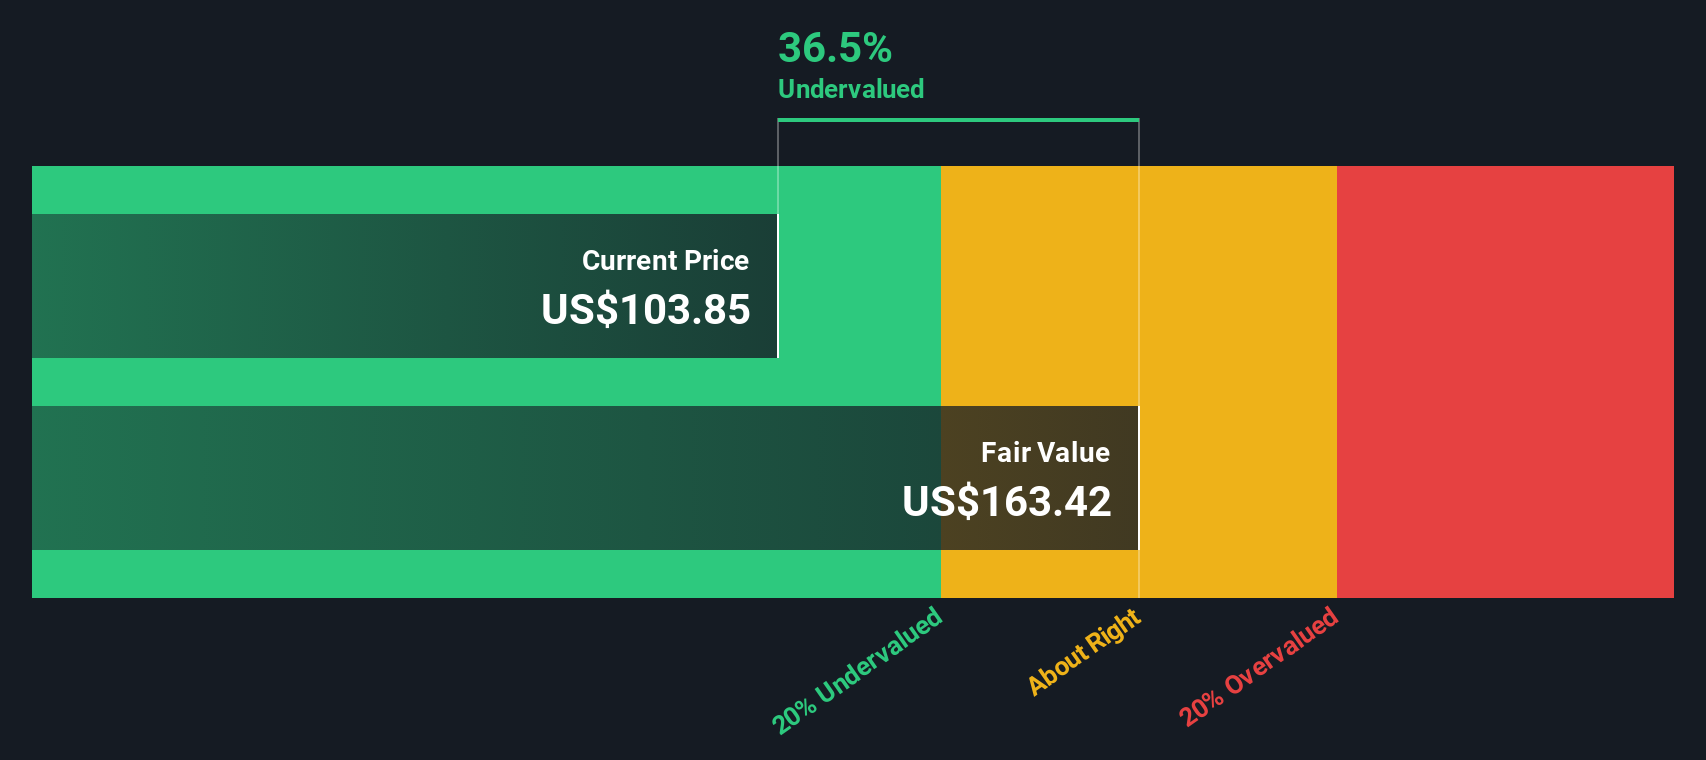
When all those projected cash flows are discounted back to today, the model arrives at an intrinsic value of about $169.29 per share. Compared with the current share price, this implies Roku trades at a 36.5% discount, suggesting the market is pricing in a much weaker long term cash flow profile than the DCF scenario.
Result: UNDERVALUED
Our Discounted Cash Flow (DCF) analysis suggests Roku is undervalued by 36.5%. Track this in your watchlist or portfolio, or discover 907 more undervalued stocks based on cash flows.
Approach 2: Roku Price vs Sales
For a business like Roku that is still focused on scaling its platform and reinvesting heavily, Price to Sales is often a more useful yardstick than earnings based ratios, because revenue tends to be more stable than profits during investment heavy phases.
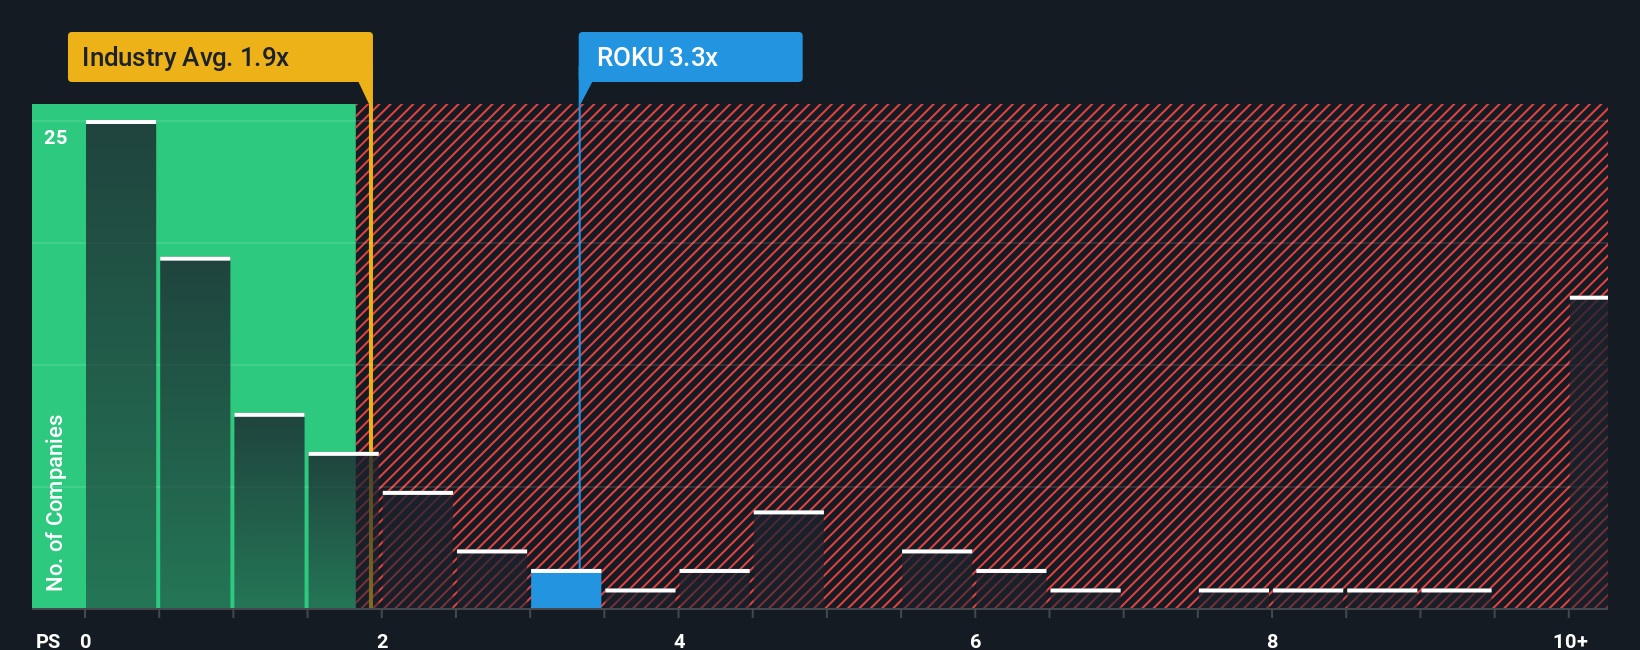
In general, higher growth and lower risk justify a higher normal multiple, while slower growth or greater uncertainty call for a lower one. Roku currently trades on a Price to Sales ratio of about 3.5x. That sits above the broader Entertainment industry average of roughly 1.4x, but a little below the 3.9x average of closer peers, suggesting the market is already pricing in solid, but not extreme, growth.
Simply Wall St’s Fair Ratio framework estimates what Price to Sales multiple Roku should trade on, given its growth outlook, profitability profile, industry and market cap. This produces a Fair Ratio of about 2.5x, which is lower than both Roku’s current multiple and the peer average. Because this approach adjusts for company specific drivers rather than relying on blunt peer comparisons, it can offer a cleaner read on valuation, and on this basis Roku screens as modestly expensive.
Result: OVERVALUED
PS ratios tell one story, but what if the real opportunity lies elsewhere? Discover 1448 companies where insiders are betting big on explosive growth.
Upgrade Your Decision Making: Choose your Roku Narrative
Earlier we mentioned that there is an even better way to understand valuation. Let us introduce you to Narratives, a simple way to attach your own story about Roku’s future to the numbers by linking your expectations for its revenue, earnings and margins to a financial forecast. The tool calculates a Fair Value and then compares that to today’s share price, all within the Narratives tool on Simply Wall St’s Community page, where millions of investors share views. Each Narrative automatically updates as new news or earnings arrive. One investor might build a bullish Roku Narrative that assumes stronger platform monetization, faster double digit revenue growth and a Fair Value well above the current price. Another might lean into the competitive and execution risks, use more conservative growth and margin assumptions, and arrive at a Fair Value below today’s price. Both investors gain a clear, dynamic framework for deciding whether Roku looks like a buy, hold or sell to them.
Do you think there's more to the story for Roku? Head over to our Community to see what others are saying!
This article by Simply Wall St is general in nature. We provide commentary based on historical data and analyst forecasts only using an unbiased methodology and our articles are not intended to be financial advice. It does not constitute a recommendation to buy or sell any stock, and does not take account of your objectives, or your financial situation. We aim to bring you long-term focused analysis driven by fundamental data. Note that our analysis may not factor in the latest price-sensitive company announcements or qualitative material. Simply Wall St has no position in any stocks mentioned.
Have feedback on this article? Concerned about the content? Get in touch with us directly. Alternatively, email editorial-team@simplywallst.com