
Home Depot (HD) Valuation Check After Recent Share Price Pullback
Why Home Depot Stock Is Back on Watch
Home Depot (HD) has slipped about 11% over the past year and roughly 15% in the past 3 months, putting the stock back on many investors watchlists as housing and renovation trends evolve.
See our latest analysis for Home Depot.
Despite a steady 3 year total shareholder return of just over 20%, sentiment has cooled lately, with a roughly 15% 3 month share price pullback to about $359, as investors reassess housing demand and big ticket renovation spend.
If Home Depot has you rethinking where the next reliable winners might come from, this could be a smart moment to explore fast growing stocks with high insider ownership.
With shares trading below analyst targets but still reflecting solid long term returns and modest growth, the key question now is whether Home Depot is quietly undervalued or if the market is already pricing in its next leg of expansion.
Most Popular Narrative: 10.8% Undervalued
With Home Depot closing at $359.65 versus a narrative fair value of $403.36, the story leans toward upside if its long term plan delivers.
The company's targeted acquisitions (SRS, pending GMS) and continued expansion of its Pro customer ecosystem are positioning Home Depot as the supplier of choice for complex, higher ticket projects, which is set to increase market share, customer lifetime value, and organic revenue growth over time.
Curious how steady, mid single digit growth, rising margins, and a richer future earnings multiple can still justify a premium price tag for a mature retailer? Dive into the full narrative to see how those moving parts combine into one ambitious valuation roadmap.
Result: Fair Value of $403.36 (UNDERVALUED)
Have a read of the narrative in full and understand what's behind the forecasts.
However, sustained weakness in big ticket remodeling and rising inventory pressures could easily derail the optimistic margin and earnings trajectory that analysts are banking on.
Find out about the key risks to this Home Depot narrative.
Another Angle on Valuation
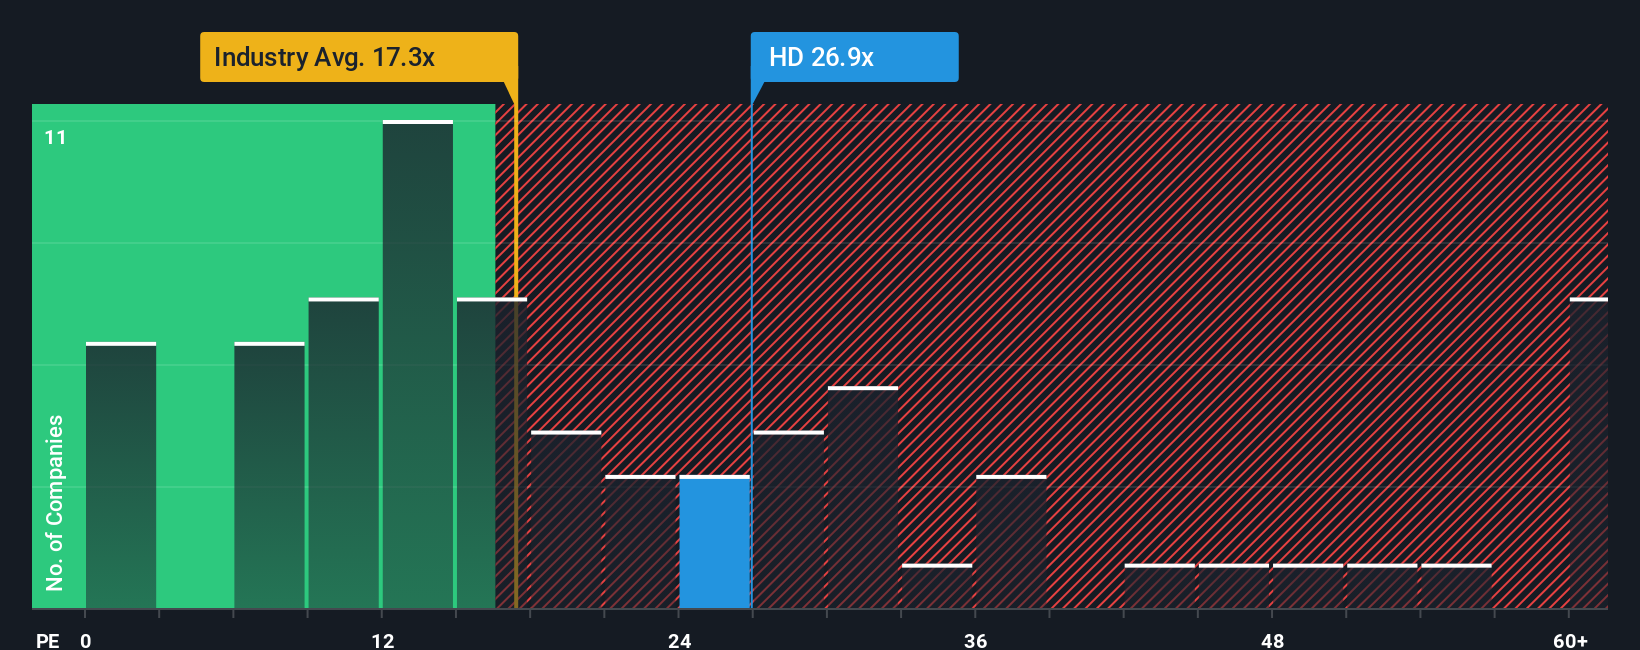
Our price to earnings lens paints a cooler picture. At 24.6 times earnings, Home Depot trades richer than the US Specialty Retail sector at 20.2 times and slightly above its fair ratio of 23.6 times, which hints that optimism here may already be baked into the price.
See what the numbers say about this price — find out in our valuation breakdown.
Simply Wall St performs a discounted cash flow (DCF) on every stock in the world every day (check out Home Depot for example). We show the entire calculation in full. You can track the result in your watchlist or portfolio and be alerted when this changes, or use our stock screener to discover 907 undervalued stocks based on their cash flows. If you save a screener we even alert you when new companies match - so you never miss a potential opportunity.
Build Your Own Home Depot Narrative
If this view does not quite match your own or you prefer digging into the numbers yourself, you can build a personalized narrative in just minutes, Do it your way.
A great starting point for your Home Depot research is our analysis highlighting 2 key rewards and 1 important warning sign that could impact your investment decision.
Ready for Your Next Investing Move?
Do not stop at one idea. Use the Simply Wall Street Screener to quickly surface fresh opportunities that match your strategy before the market fully catches on.
- Target dependable income streams by checking out these 13 dividend stocks with yields > 3% and see which companies might help keep your cash flow steady when markets turn choppy.
- Capitalize on mispriced opportunities through these 907 undervalued stocks based on cash flows, where strong cash flow profiles could indicate potential opportunities trading at current discounts.
- Explore the next digital wave with these 80 cryptocurrency and blockchain stocks and pinpoint businesses involved in blockchain infrastructure and financial innovation.
This article by Simply Wall St is general in nature. We provide commentary based on historical data and analyst forecasts only using an unbiased methodology and our articles are not intended to be financial advice. It does not constitute a recommendation to buy or sell any stock, and does not take account of your objectives, or your financial situation. We aim to bring you long-term focused analysis driven by fundamental data. Note that our analysis may not factor in the latest price-sensitive company announcements or qualitative material. Simply Wall St has no position in any stocks mentioned.
Have feedback on this article? Concerned about the content? Get in touch with us directly. Alternatively, email editorial-team@simplywallst.com