
Manchester United (MANU) Valuation Check as Shares Drift Lower and Growth Prospects Are Reassessed
Manchester United (MANU) shares have been grinding lower this year, down about 9% year to date and roughly 11% over the past year, leaving investors reassessing how much off pitch performance really matters.
See our latest analysis for Manchester United.
The recent drift lower, including a 1 day share price return of minus 2.41 percent and a 3 year total shareholder return of minus 29.52 percent, suggests momentum is still fading as investors reassess both growth prospects and ownership uncertainty.
If this kind of drawn out story has you thinking beyond a single club, it could be a useful time to explore fast growing stocks with high insider ownership.
With the share price lagging despite improving revenue and a sizable discount to analyst targets, the key question now is whether Manchester United is quietly undervalued or if the market has already priced in any future rebound in growth.
Price to Sales of 3x, Is it Justified?
On a price to sales basis, Manchester United trades at roughly 3 times revenue, which looks demanding against both peers and the wider entertainment industry.
The price to sales ratio compares the company’s market value with the revenue it generates. It is a common yardstick for clubs and media driven businesses where earnings can be volatile. For Manchester United, this multiple helps investors judge how much they are paying today for each pound of current and future matchday, broadcasting and commercial income.
Relative to similar peers, the stock appears slightly cheap, as it trades on 3 times sales compared with a peer average of about 3.1 times. However, when compared with the broader US entertainment space, where the average is closer to 1.4 times, the shares trade at a steep premium. They also sit well above an estimated fair price to sales level of around 2.1 times that our regression based fair ratio identifies as a more sustainable anchor.
Explore the SWS fair ratio for Manchester United
Result: Price to Sales of 3x (OVERVALUED)
However, lingering ownership uncertainty and ongoing net losses could still derail any re rating, especially if performance on the pitch fails to translate into sustained commercial growth.
Find out about the key risks to this Manchester United narrative.
Another View on Value
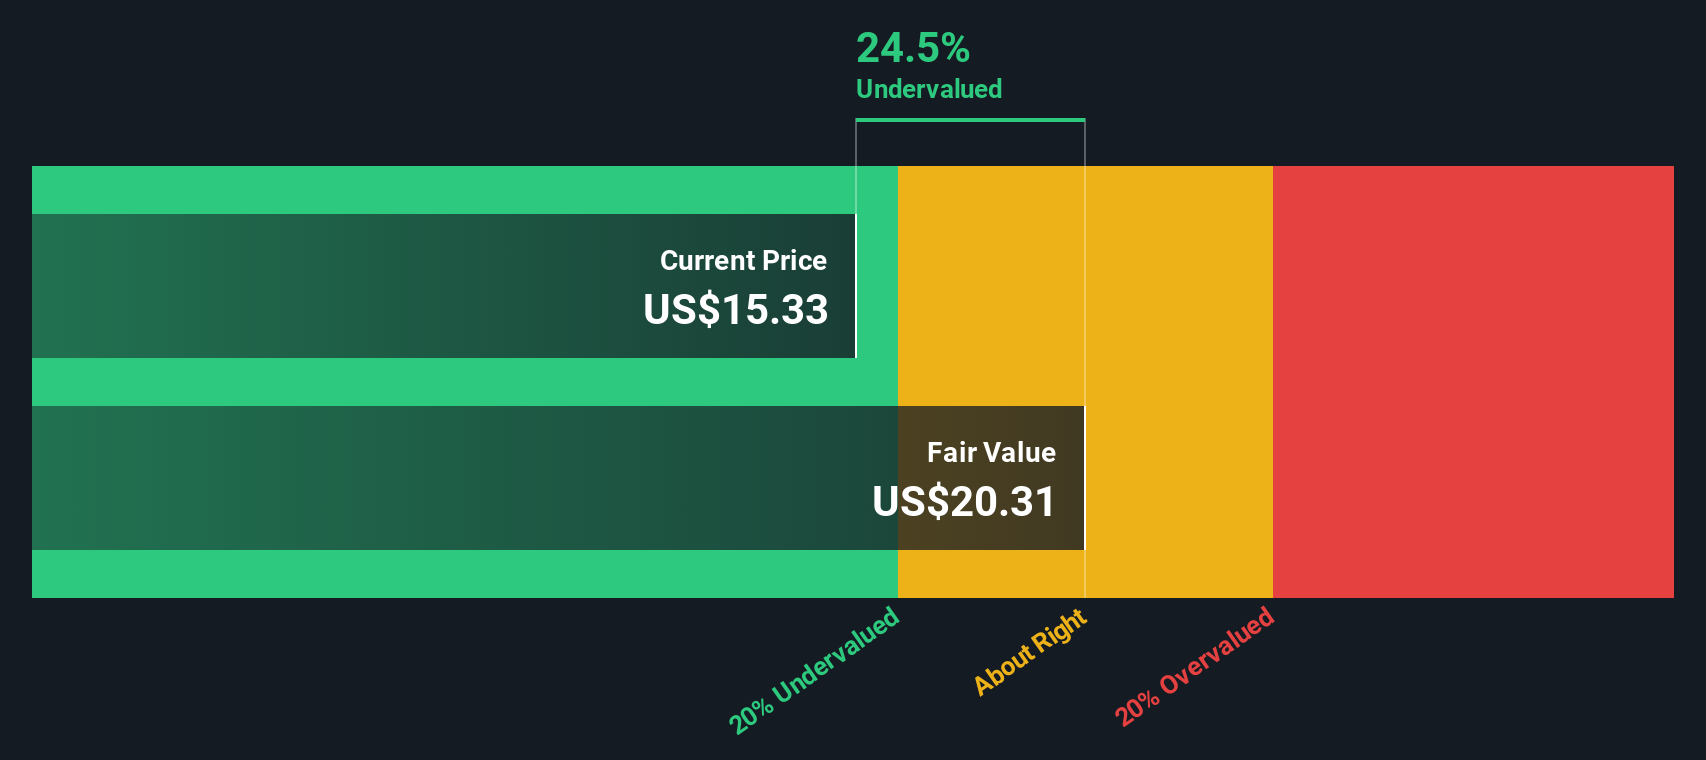
While the 3 times sales multiple looks stretched, our DCF model points the other way, suggesting shares trade about 25.9 percent below a fair value of roughly 20.79 dollars. One lens flags overvaluation; the other a discount. Which story will the market ultimately believe?
Look into how the SWS DCF model arrives at its fair value.
Simply Wall St performs a discounted cash flow (DCF) on every stock in the world every day (check out Manchester United for example). We show the entire calculation in full. You can track the result in your watchlist or portfolio and be alerted when this changes, or use our stock screener to discover 907 undervalued stocks based on their cash flows. If you save a screener we even alert you when new companies match - so you never miss a potential opportunity.
Build Your Own Manchester United Narrative
If you see the numbers differently or would rather dig into the details yourself, you can build a fresh view in just minutes: Do it your way.
A great starting point for your Manchester United research is our analysis highlighting 3 key rewards and 1 important warning sign that could impact your investment decision.
Ready for more compelling investment ideas?
Before you move on, lock in your next opportunity by using the Simply Wall Street Screener to uncover stocks that match your strategy and strengthen your portfolio.
- Target steady income potential by reviewing these 13 dividend stocks with yields > 3% that can support long term wealth building through reliable payouts.
- Capitalize on innovation by scanning these 26 AI penny stocks shaping the next wave of intelligent software and automation.
- Position yourself for value gains by focusing on these 907 undervalued stocks based on cash flows that trade below their estimated cash flow potential.
This article by Simply Wall St is general in nature. We provide commentary based on historical data and analyst forecasts only using an unbiased methodology and our articles are not intended to be financial advice. It does not constitute a recommendation to buy or sell any stock, and does not take account of your objectives, or your financial situation. We aim to bring you long-term focused analysis driven by fundamental data. Note that our analysis may not factor in the latest price-sensitive company announcements or qualitative material. Simply Wall St has no position in any stocks mentioned.
Have feedback on this article? Concerned about the content? Get in touch with us directly. Alternatively, email editorial-team@simplywallst.com