
Star Bulk Carriers (SBLK): Assessing Valuation After a Recent 11% Pullback in the Share Price
Star Bulk Carriers (SBLK) has quietly slipped about 11% over the past week, even though its year to date return is still up roughly 18%. That disconnect is where the opportunity becomes interesting for patient, income-focused investors.
See our latest analysis for Star Bulk Carriers.
That recent 7 day share price return of negative 10.66% looks more like a breather than a breakdown. The stock still sits on a solid year to date share price return of 17.87% and a 5 year total shareholder return of 284.73%, suggesting momentum has cooled but the longer term trend remains constructive.
If this pullback has you scanning for other ideas in shipping exposed sectors, it might also be a smart moment to broaden your search and discover fast growing stocks with high insider ownership.
With the shares trading at a noticeable discount to analyst targets despite double digit revenue and explosive earnings growth, is Star Bulk quietly drifting into value territory, or is the market already anchoring in its next leg of expansion?
Most Popular Narrative: 19.8% Undervalued
With Star Bulk Carriers last closing at $18.27 against a narrative fair value of $22.78, the current gap frames an aggressive earnings power story.
Limited new vessel supply, caused by a historically low orderbook, strong shipyard constraints, and uncertainty around future green technologies, should maintain a tight tonnage market through 2027, allowing Star Bulk to benefit from stronger utilization and higher time charter revenues.
Curious how flat headline revenues can still underpin a sharply higher earnings base and lower future multiple than the industry benchmark? The narrative walks through those moving parts.
Result: Fair Value of $22.78 (UNDERVALUED)
Have a read of the narrative in full and understand what's behind the forecasts.
However, structural softness in dry bulk demand and Star Bulk’s aging, capital intensive fleet could quickly erode the margin and valuation upside embedded in this story.
Find out about the key risks to this Star Bulk Carriers narrative.
Another Lens on Value
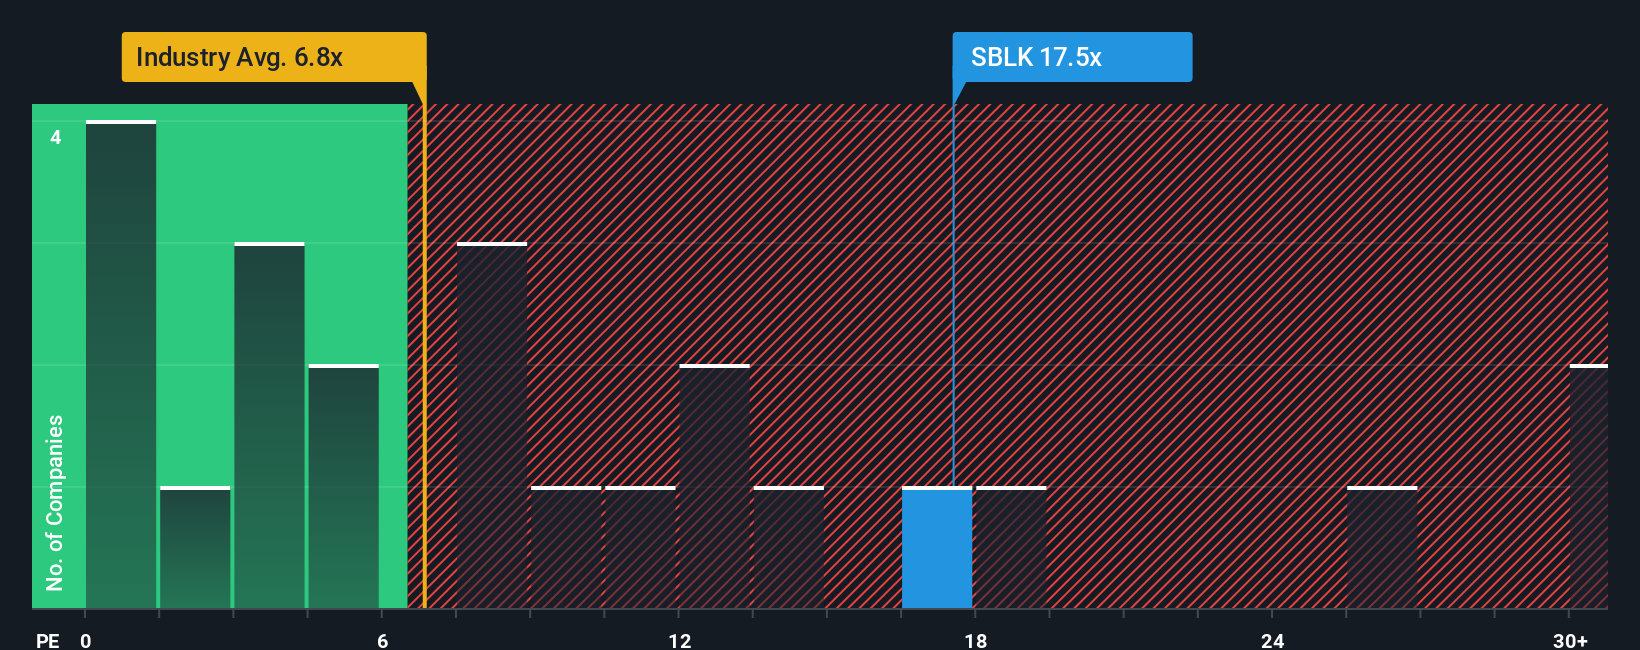
On earnings multiples, the picture flips. Star Bulk trades on a price to earnings ratio of 33.8 times, far richer than the global shipping average of 9.9 times and peer average of 5.1 times, and even above its fair ratio of 43.7 times that the market could gravitate toward. This raises the question of how much upside is really left if growth wobbles.
See what the numbers say about this price — find out in our valuation breakdown.
Build Your Own Star Bulk Carriers Narrative
If you are unconvinced by this angle or simply prefer to dig into the numbers yourself, you can craft a tailored view in just a few minutes: Do it your way.
A great starting point for your Star Bulk Carriers research is our analysis highlighting 3 key rewards and 1 important warning sign that could impact your investment decision.
Looking for your next investing edge?
Before you move on, lock in a few high conviction ideas by scanning screened opportunities that match your style, so you are not chasing them later.
- Target income you can actually see by reviewing these 13 dividend stocks with yields > 3% that may offer reliable cash returns in changing markets.
- Get ahead of the next productivity boom by checking out these 26 AI penny stocks shaping the future of automation, data, and intelligent software.
- Strengthen your value watchlist with these 907 undervalued stocks based on cash flows that the market has not fully priced yet.
This article by Simply Wall St is general in nature. We provide commentary based on historical data and analyst forecasts only using an unbiased methodology and our articles are not intended to be financial advice. It does not constitute a recommendation to buy or sell any stock, and does not take account of your objectives, or your financial situation. We aim to bring you long-term focused analysis driven by fundamental data. Note that our analysis may not factor in the latest price-sensitive company announcements or qualitative material. Simply Wall St has no position in any stocks mentioned.
Have feedback on this article? Concerned about the content? Get in touch with us directly. Alternatively, email editorial-team@simplywallst.com