
Assessing Solaris Energy Infrastructure After 56% YTD Surge and Strong Cash Flow Outlook
- Wondering if Solaris Energy Infrastructure is still a smart buy after its huge run up, or if you are arriving late to the party? We are going to unpack what the current share price really implies about future returns.
- Even after a sharp pullback of 16.8% over the last week and a modest 2.6% slide over the past month, the stock is still up 56.4% year to date and 67.0% over the last year, capping a 439.8% three year and 540.9% five year run.
- Those swings have come as investors digest a series of upbeat pipeline expansion announcements and long term offtake agreements that strengthen Solaris Energy Infrastructure's contracted cash flow base. At the same time, sector wide debates about the pace of the energy transition and midstream regulation have injected some volatility into sentiment.
- On our framework, Solaris Energy Infrastructure currently earns a valuation score of 3 out of 6. This means it looks undervalued on half of the checks we run. Next we will walk through what different valuation approaches say about that number, before finishing with a more powerful way to make sense of the company’s true worth.
Approach 1: Solaris Energy Infrastructure Discounted Cash Flow (DCF) Analysis
The Discounted Cash Flow, or DCF, model projects Solaris Energy Infrastructure’s future cash flows and then discounts them back to today’s dollars to estimate what the business is worth now.
Solaris currently generates Last Twelve Months free cash flow of about $191 million in the red, reflecting heavy investment and ramp up costs. Analysts see this turning positive and scaling quickly, with free cash flow expected to reach about $517 million by 2028. Beyond those analyst years, Simply Wall St extrapolates the trajectory, with projections climbing to roughly $3.28 billion of free cash flow by 2035, all in $ and adjusted back to today’s value.
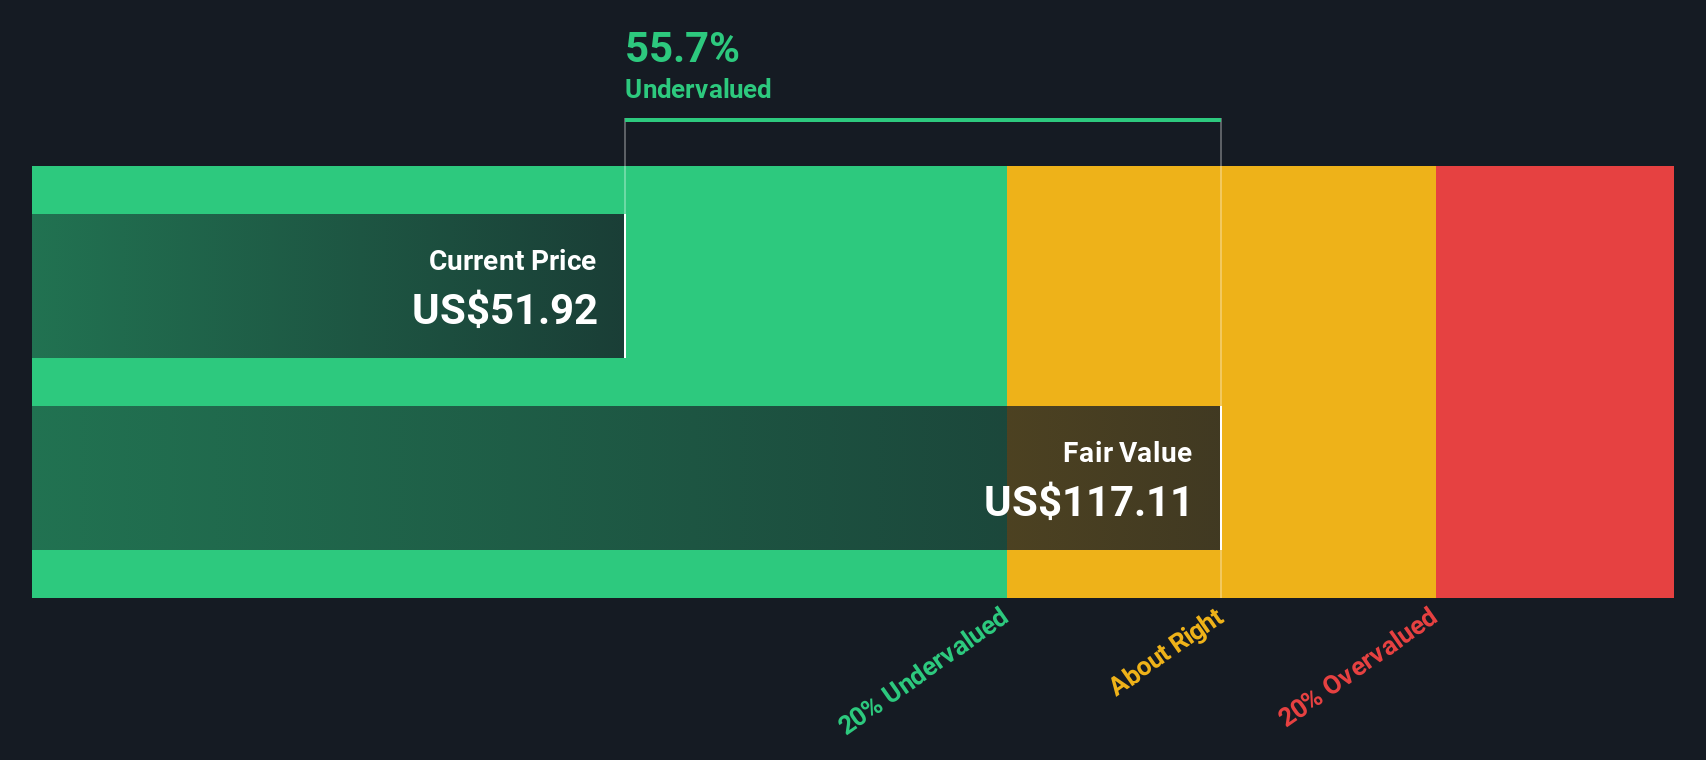
On this basis, the 2 Stage Free Cash Flow to Equity model arrives at an intrinsic value of about $739.47 per share. Compared with the current market price, this implies the stock is trading at roughly a 93.8% discount, which indicates that investors are paying far less than the cash flow outlook would justify.
Result: UNDERVALUED
Our Discounted Cash Flow (DCF) analysis suggests Solaris Energy Infrastructure is undervalued by 93.8%. Track this in your watchlist or portfolio, or discover 907 more undervalued stocks based on cash flows.
Approach 2: Solaris Energy Infrastructure Price vs Earnings
For profitable companies, the price to earnings ratio is often the cleanest way to see how much investors are willing to pay for each dollar of current profit, which makes it a useful cross check on the more complex DCF work. A higher PE can be justified when a business has strong and durable earnings growth with manageable risk, while slower or more volatile growers usually warrant a lower, more cautious multiple.
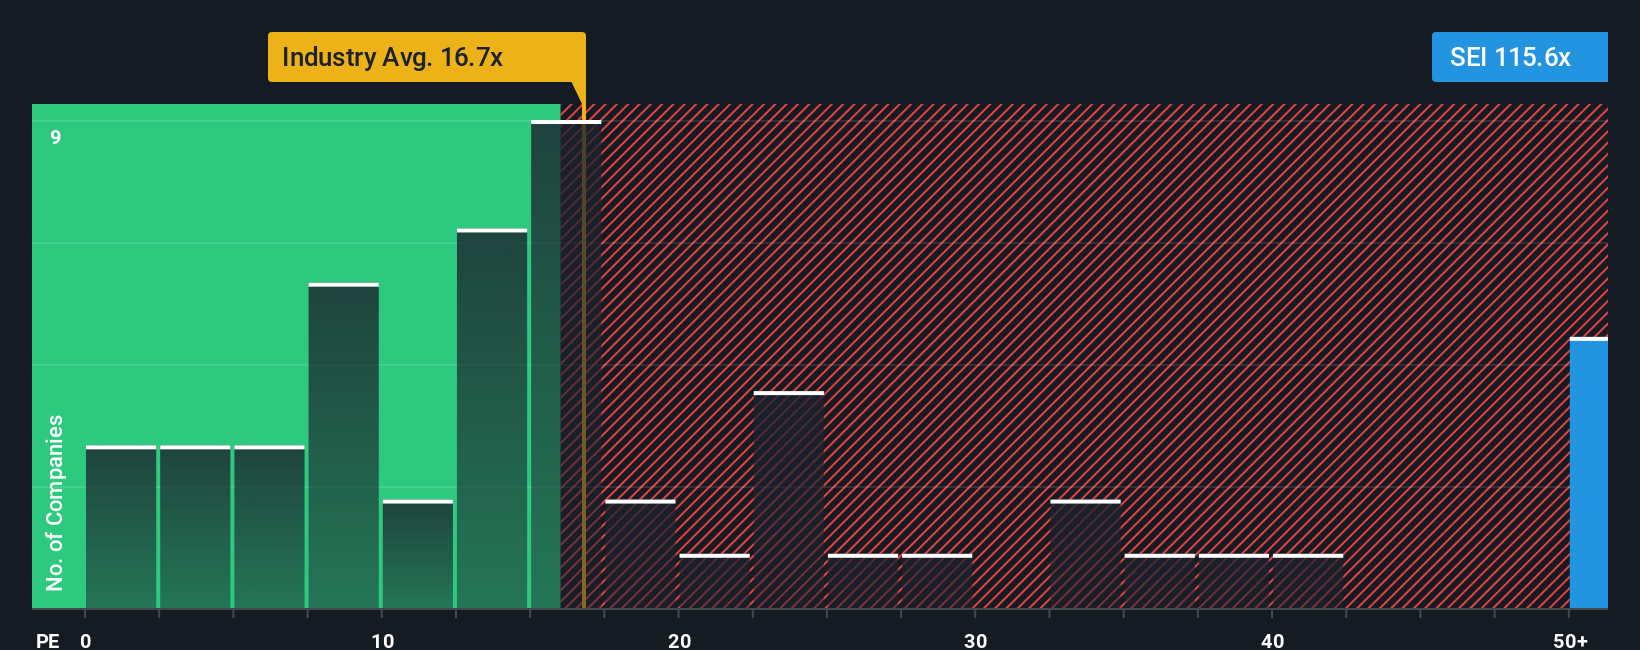
Solaris Energy Infrastructure currently trades on a PE of 61.9x, which is far richer than the Energy Services industry average of about 18.4x and above the broader peer group at roughly 19.5x. To move beyond those blunt comparisons, Simply Wall St estimates a Fair Ratio of 25.7x for Solaris. This proprietary metric reflects the company’s specific earnings growth outlook, profitability, risk profile, industry positioning and market cap, so it provides a more tailored sense of what investors should be prepared to pay.
When we set the current 61.9x PE against the 25.7x Fair Ratio, the market price still looks ahead of what the fundamentals justify on this metric alone, even allowing for Solaris’s growth story.
Result: OVERVALUED
PE ratios tell one story, but what if the real opportunity lies elsewhere? Discover 1448 companies where insiders are betting big on explosive growth.
Upgrade Your Decision Making: Choose your Solaris Energy Infrastructure Narrative
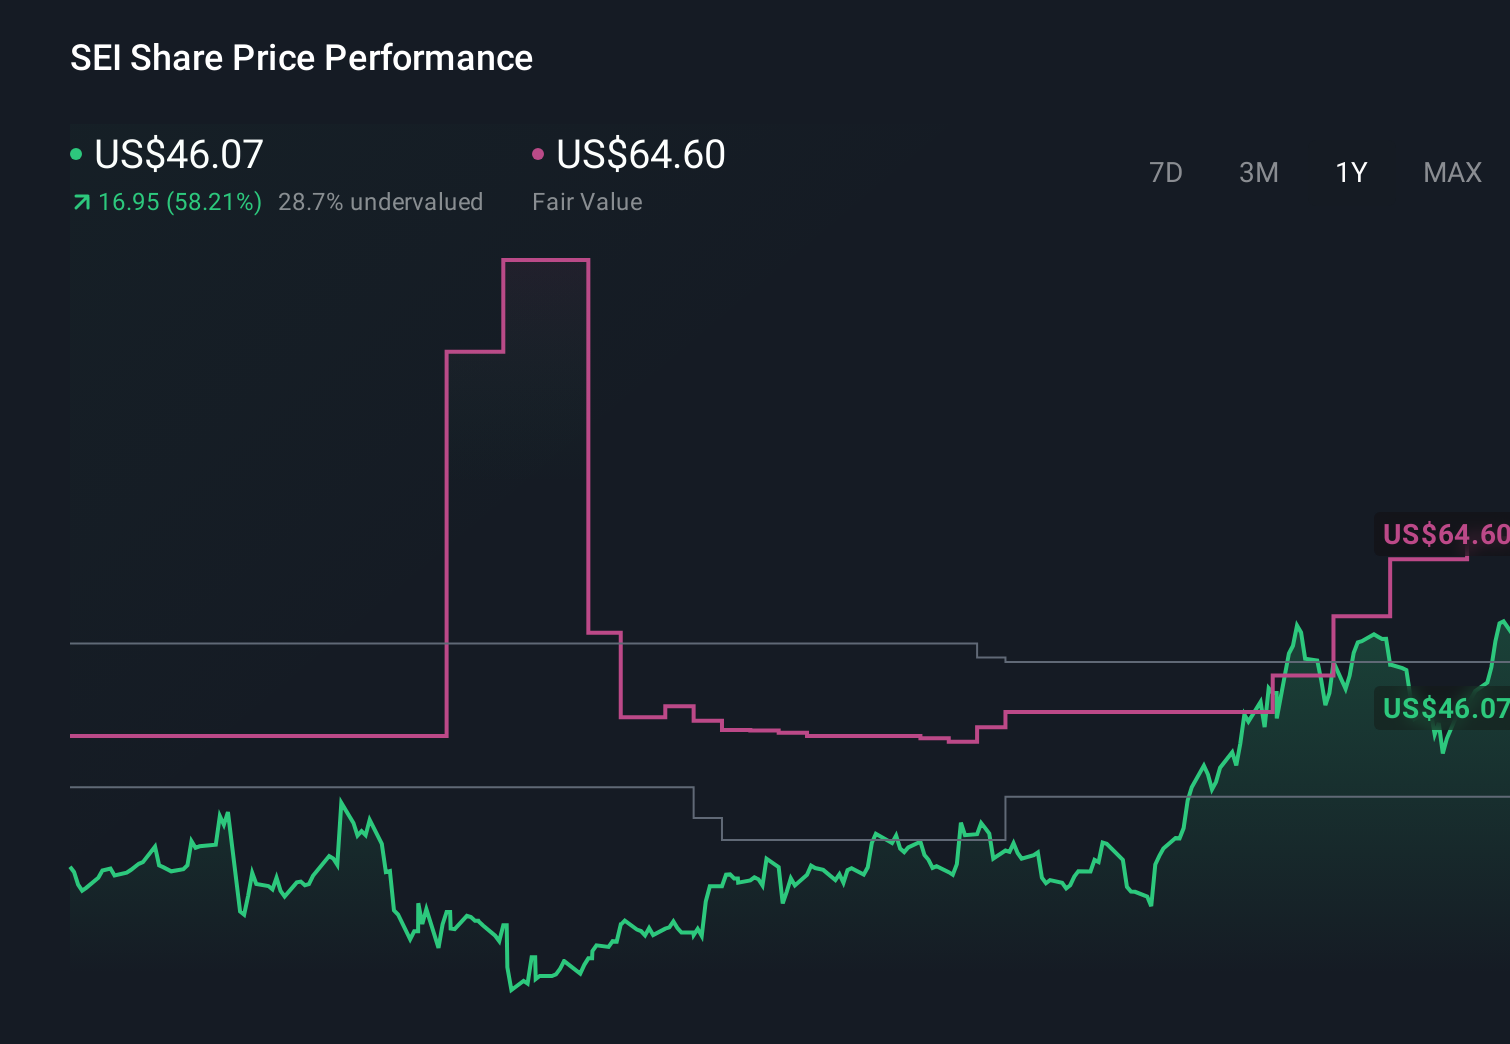
Earlier we mentioned that there is an even better way to understand valuation. Let us introduce Narratives, which are simple stories you create about a company that sit behind your numbers such as fair value, and your assumptions for future revenue, earnings and margins. Narratives link the company’s real world story to a financial forecast and then to a fair value estimate you can compare to today’s price on Simply Wall St’s Community page. Millions of investors already use Narratives as an easy, accessible tool that automatically updates when new information like earnings or news arrives. Narratives can help you decide when to buy or sell by showing whether your Narrative Fair Value still supports the current share price. For example, one Solaris Energy Infrastructure Narrative might lean bullish and land closer to the approximately $64.60 fair value with strong growth and margins incorporated, while a more cautious Narrative might anchor nearer the $38.00 end of the analyst range, assuming slower growth or lower profitability. This gives you a clear, dynamic way to see how different perspectives translate into different investment decisions.
Do you think there's more to the story for Solaris Energy Infrastructure? Head over to our Community to see what others are saying!
This article by Simply Wall St is general in nature. We provide commentary based on historical data and analyst forecasts only using an unbiased methodology and our articles are not intended to be financial advice. It does not constitute a recommendation to buy or sell any stock, and does not take account of your objectives, or your financial situation. We aim to bring you long-term focused analysis driven by fundamental data. Note that our analysis may not factor in the latest price-sensitive company announcements or qualitative material. Simply Wall St has no position in any stocks mentioned.
Have feedback on this article? Concerned about the content? Get in touch with us directly. Alternatively, email editorial-team@simplywallst.com