
Is ON Semiconductor Fairly Priced After Recent Share Recovery and Premium Earnings Multiple in 2025
- If you are wondering whether ON Semiconductor is quietly turning into a value opportunity, or if the market still sees too much risk in the story, you are not alone.
- The stock has inched up about 0.4% over the last week and 11.5% over the past month, but it is still down 10.9% year to date and 16.7% over the last year, a reminder that past enthusiasm has cooled even though the 5 year return sits at 74.3%.
- Recently, investors have been weighing ON Semiconductor's positioning in electric vehicles, power management, and industrial applications as policy support for clean energy and electrification continues to build. Industry headlines around tighter chip supply chains and shifting demand across auto and industrial customers have also shaped sentiment, helping to explain the stock's choppy recovery.
- Right now, ON Semiconductor only scores a 1 out of 6 on our valuation checks, which suggests the market may not see it as a screaming bargain just yet. Next, we will look at the different valuation approaches investors are using, and later return to a more practical way to judge whether the current price makes sense for your strategy.
ON Semiconductor scores just 1/6 on our valuation checks. See what other red flags we found in the full valuation breakdown.
Approach 1: ON Semiconductor Discounted Cash Flow (DCF) Analysis
A Discounted Cash Flow model estimates what a business is worth by projecting the cash it can generate in the future and discounting those cash flows back to today's value. For ON Semiconductor, the model used is a 2 Stage Free Cash Flow to Equity approach, based on cash flow projections.
The company generated about $989.4 Million in free cash flow over the last twelve months, and analyst based projections see this climbing to around $2.17 Billion by 2035 as the business scales. Nearer term, forecasts point to roughly $1.70 Billion in 2026 and $1.92 Billion in 2027, with later years extrapolated by Simply Wall St once analyst estimates run out.
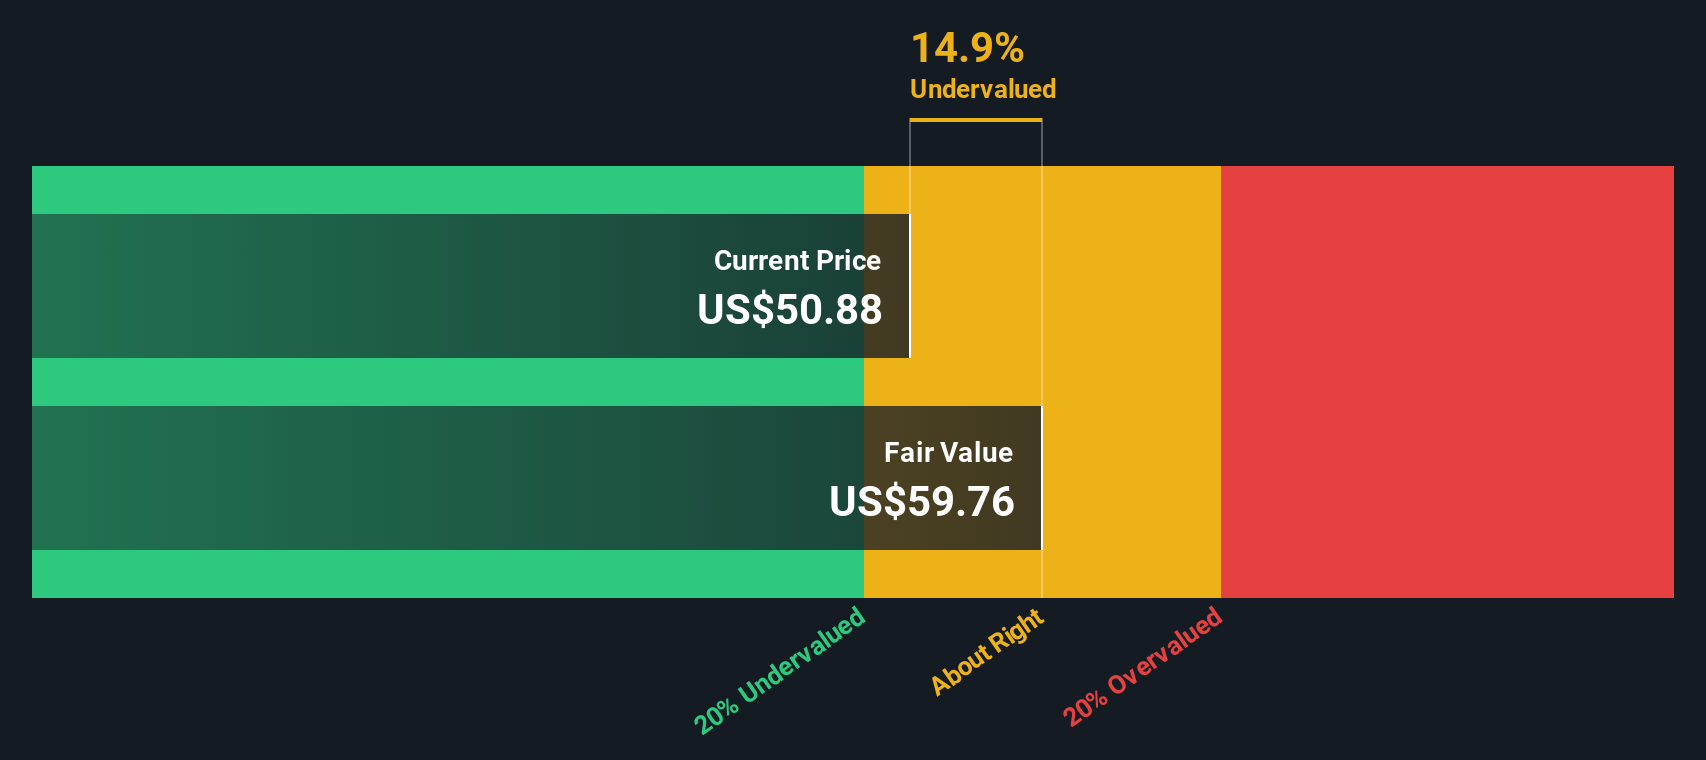
Bringing all of those projected cash flows back to today yields an estimated intrinsic value of about $55.25 per share. With the DCF implying the stock is only 0.5% undervalued relative to the current price, the model suggests ON Semiconductor is trading very close to its calculated fair value.
Result: ABOUT RIGHT
ON Semiconductor is fairly valued according to our Discounted Cash Flow (DCF), but this can change at a moment's notice. Track the value in your watchlist or portfolio and be alerted on when to act.
Approach 2: ON Semiconductor Price vs Earnings
For a profitable business like ON Semiconductor, the price to earnings ratio is a useful way to gauge how much investors are willing to pay for each dollar of current profit. In general, faster growing and lower risk companies can justify higher PE ratios, while slower growth or greater uncertainty usually call for a lower, more conservative multiple.
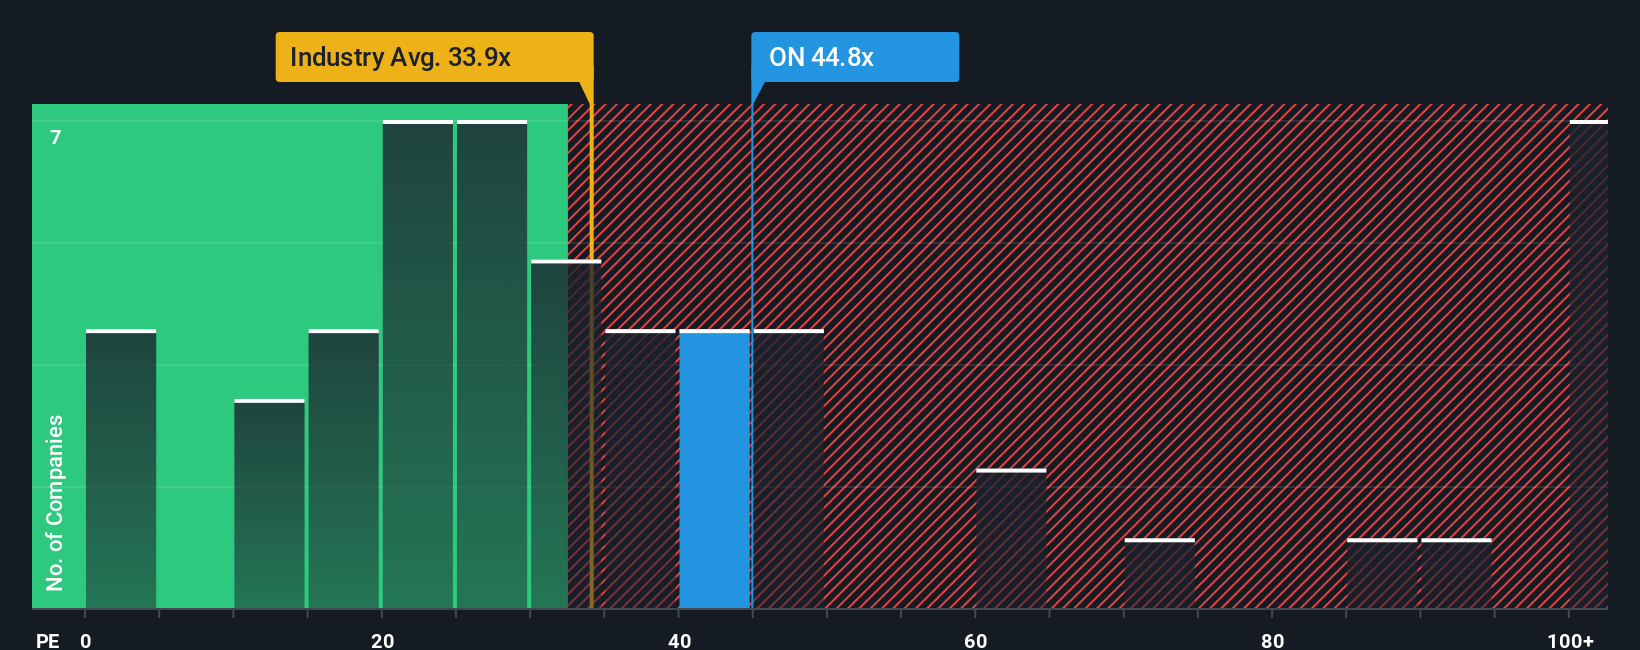
ON Semiconductor currently trades at about 69.30x earnings, which is well above both the Semiconductor industry average of roughly 37.03x and the peer average of around 35.57x. On the surface, that makes the stock look expensive compared to many of its listed competitors. However, Simply Wall St also calculates a Fair Ratio of 58.05x for ON, which is the PE level that would be expected given the company’s specific mix of earnings growth, profitability, industry dynamics, market cap and risk profile.
This Fair Ratio is more tailored than a simple comparison to peers or the industry, because it adjusts for ON Semiconductor's own fundamentals rather than assuming all chipmakers deserve the same multiple. With the current PE of 69.30x sitting comfortably above the 58.05x Fair Ratio, the shares look stretched on this metric.
Result: OVERVALUED
PE ratios tell one story, but what if the real opportunity lies elsewhere? Discover 1448 companies where insiders are betting big on explosive growth.
Upgrade Your Decision Making: Choose your ON Semiconductor Narrative
Earlier we mentioned that there is an even better way to understand valuation, so let's introduce you to Narratives, a simple way to connect the story you believe about a company with the numbers behind its future.
A Narrative is your structured perspective on ON Semiconductor, where you spell out what you think will happen to its revenue, earnings and margins, and link that story to a financial forecast and then to a fair value estimate.
On Simply Wall St, Narratives are easy to build and explore within the Community page, where millions of investors share how their assumptions translate into fair values they can compare directly against the current share price to help inform their own decisions.
Because Narratives update dynamically as new news, earnings releases and guidance arrive, they help you continuously test whether your original story about ON still holds, or needs to be adjusted.
For example, one ON Semiconductor Narrative might assume that EV, AI and silicon carbide momentum justify a fair value near the optimistic target of around $70. A more cautious Narrative focusing on cyclical risks and competition might put fair value closer to the low end near $40.
Do you think there's more to the story for ON Semiconductor? Head over to our Community to see what others are saying!

This article by Simply Wall St is general in nature. We provide commentary based on historical data and analyst forecasts only using an unbiased methodology and our articles are not intended to be financial advice. It does not constitute a recommendation to buy or sell any stock, and does not take account of your objectives, or your financial situation. We aim to bring you long-term focused analysis driven by fundamental data. Note that our analysis may not factor in the latest price-sensitive company announcements or qualitative material. Simply Wall St has no position in any stocks mentioned.
Have feedback on this article? Concerned about the content? Get in touch with us directly. Alternatively, email editorial-team@simplywallst.com