
Has the ASICS Share Price Surge Gone Too Far in 2025?
- Wondering if ASICS is still a smart buy after a huge run up in recent years, or if the easy money has already been made? You are not alone.
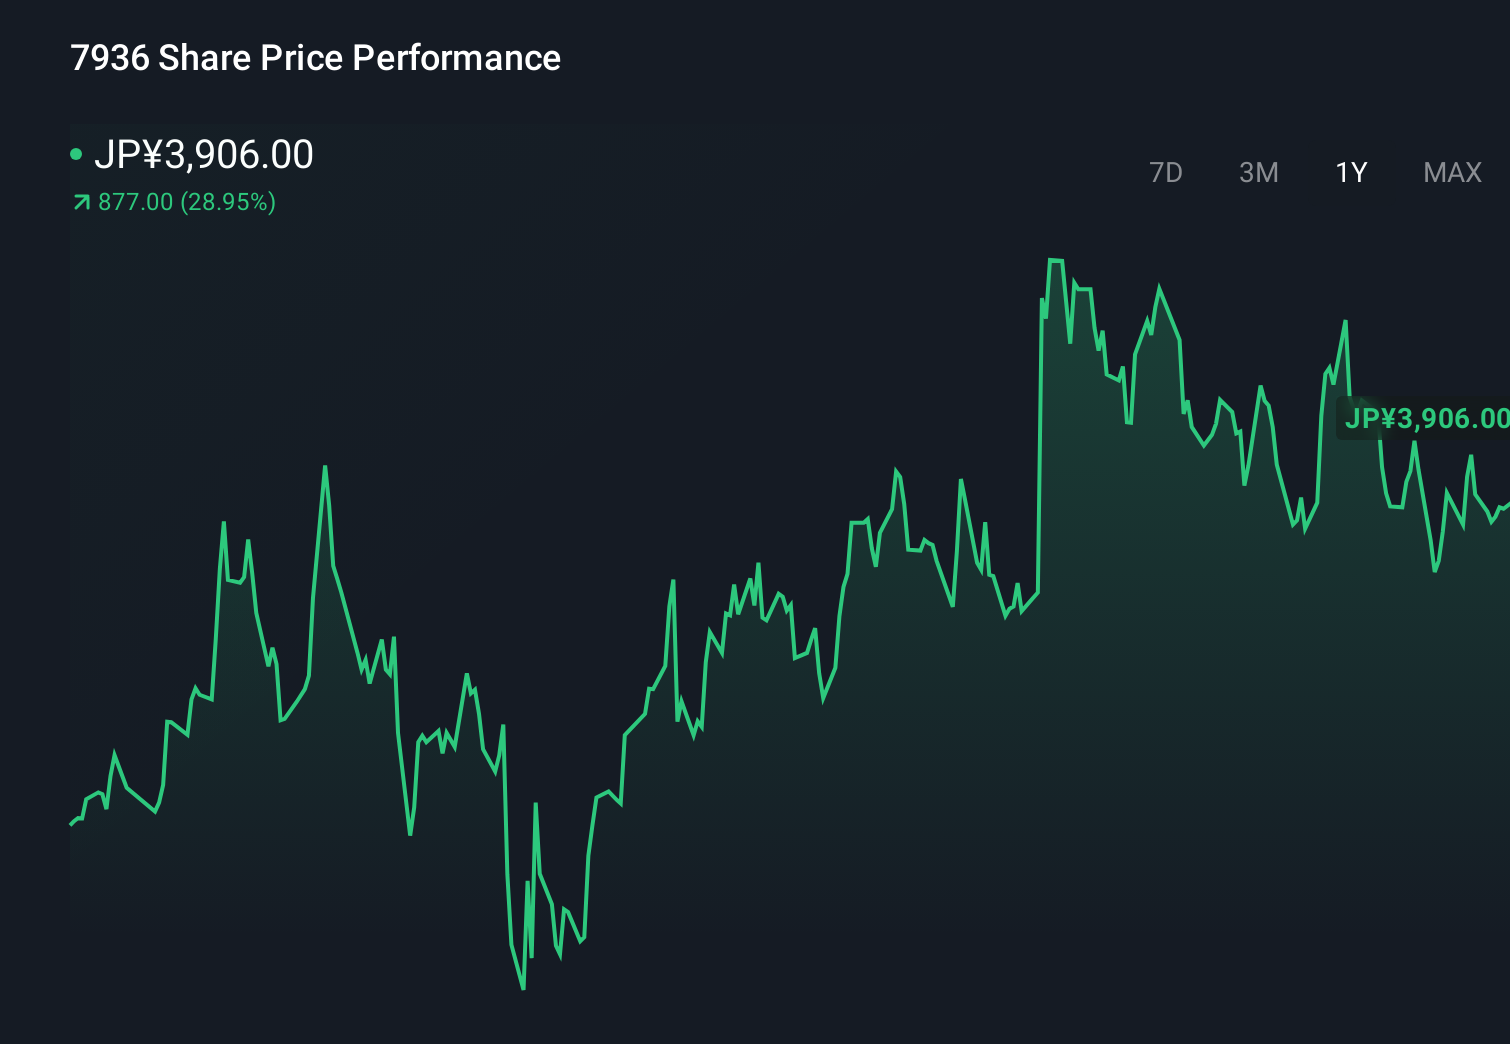
- The stock has climbed 5.3% over the last week, 27.7% year to date, and 28.1% over the past year, capping a 434.9% gain over three years and 721.2% over five years.
- Those moves have come as ASICS has steadily rebuilt its brand image worldwide, with momentum in performance running and lifestyle sneakers helping it win back shelf space and attention from major retailers. At the same time, investors have warmed to the broader athletic and footwear theme again, seeing ASICS as a quality name that had been overlooked compared to larger global peers.
- Despite that backdrop, ASICS currently scores just 0/6 on our valuation checks. This suggests the market may already be pricing in a lot of good news. Next, we will break down what different valuation approaches say about the stock, before finishing with a more holistic way to think about its worth.
ASICS scores just 0/6 on our valuation checks. See what other red flags we found in the full valuation breakdown.
Approach 1: ASICS Discounted Cash Flow (DCF) Analysis
A Discounted Cash Flow, or DCF, model estimates what a business is worth today by projecting its future cash flows and then discounting those back to their value in today’s money. For ASICS, the 2 Stage Free Cash Flow to Equity model starts with its latest twelve month free cash flow of about ¥85.5 billion and incorporates analyst expectations for steady growth.
Analysts see free cash flow rising into the next decade, with projections by 2029 of roughly ¥131.2 billion, and further extrapolated growth beyond that. These long term estimates combine explicit analyst forecasts for the first few years with Simply Wall St’s own growth assumptions thereafter, which is typical for this kind of model when detailed forecasts are not available.
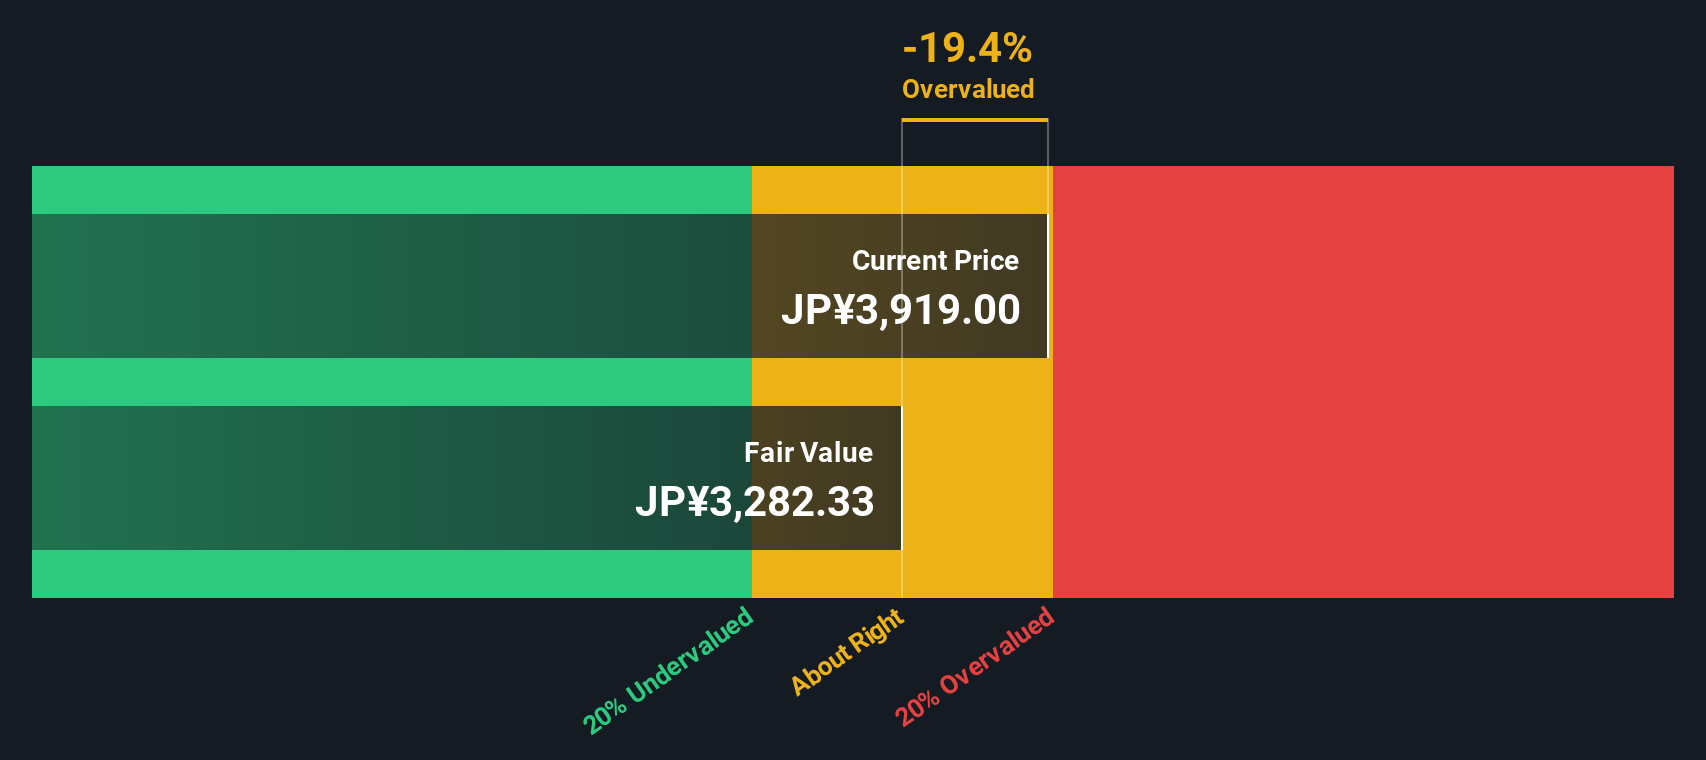
Bringing all those projected cash flows back to today’s value produces an estimated fair value of around ¥3,183 per share. Compared with the current market price, the model implies ASICS is roughly 22.7% overvalued on a pure cash flow basis.
Result: OVERVALUED
Our Discounted Cash Flow (DCF) analysis suggests ASICS may be overvalued by 22.7%. Discover 907 undervalued stocks or create your own screener to find better value opportunities.
Approach 2: ASICS Price vs Earnings
For profitable companies like ASICS, the price to earnings (PE) ratio is a useful yardstick because it directly links what investors pay for each share to the profits the business is generating today. In general, faster growing, lower risk businesses tend to justify a higher PE ratio, while slower growing or riskier ones usually deserve a lower multiple.
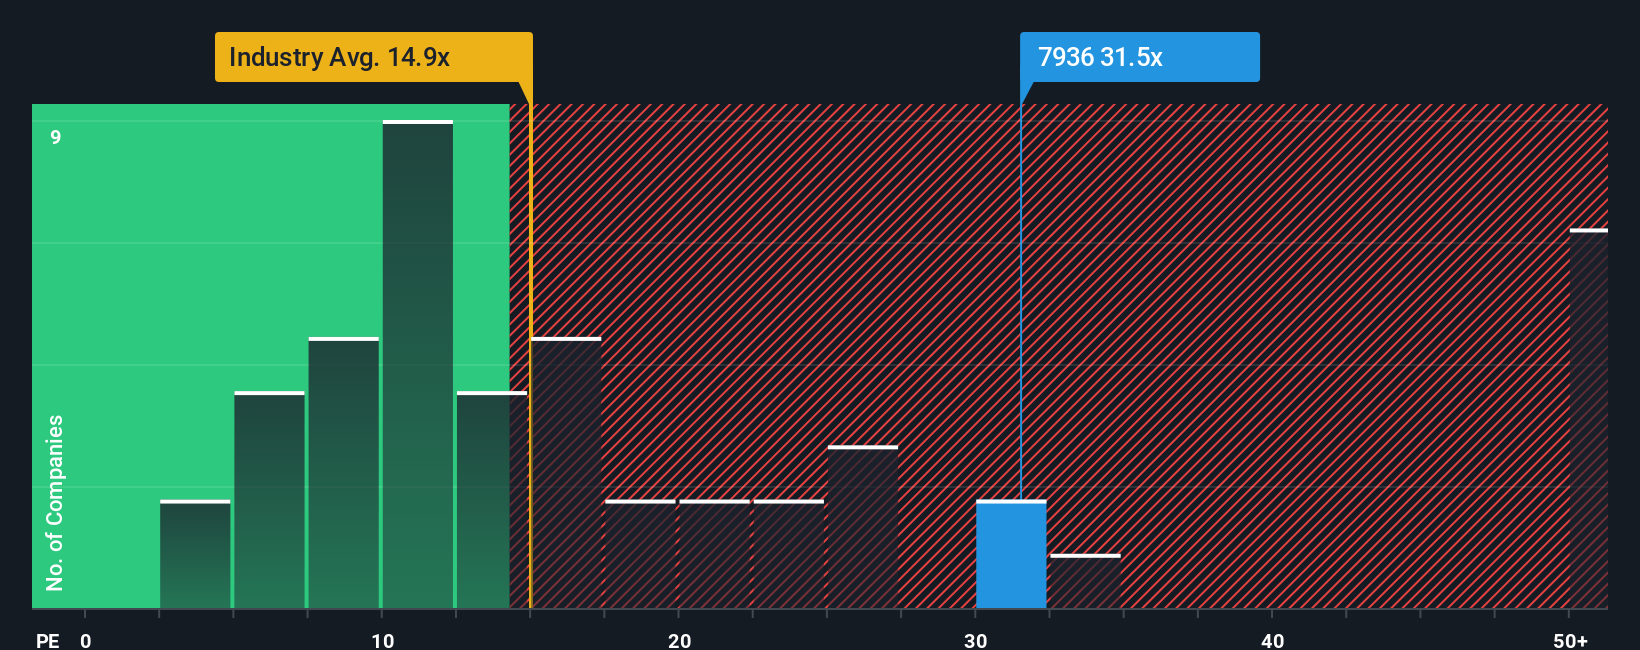
ASICS currently trades on about 32.9x earnings, which is more than double the Luxury industry average of roughly 14.7x and meaningfully higher than the broader peer group at around 14.7x. That alone suggests the stock is priced for strong execution and sustained growth. To go a step further, Simply Wall St estimates a proprietary Fair Ratio of 23.6x for ASICS, which reflects its specific mix of earnings growth, margins, industry, size and risk profile. This Fair Ratio is more tailored than simple peer or industry comparisons, which can overlook important differences in business quality and prospects.
Putting this together, ASICS appears significantly more expensive than its Fair Ratio would suggest, implying the market is paying a premium that may be hard to sustain if growth or profitability disappoint.
Result: OVERVALUED
PE ratios tell one story, but what if the real opportunity lies elsewhere? Discover 1448 companies where insiders are betting big on explosive growth.
Upgrade Your Decision Making: Choose your ASICS Narrative
Earlier we mentioned that there is an even better way to understand valuation, so let us introduce you to Narratives, a smarter and more flexible way to frame your investment decisions. A Narrative is simply your story about a company, translated into numbers like fair value, future revenue, earnings and profit margins, so that your view becomes a clear, testable forecast. Instead of treating valuation as a single, fixed answer, Narratives connect three pieces: what you believe about ASICS as a business, how that belief flows into a financial forecast, and what fair value that forecast implies. On Simply Wall St, millions of investors build and compare Narratives on the Community page, using them as an easy tool to see whether a stock looks relatively attractive or unattractive by lining up its Fair Value against today’s Price. These Narratives automatically update when new information, such as earnings releases or major news, changes the outlook. For ASICS, one Narrative might assume premium brand momentum and strong margin expansion, while another expects growth to slow and margins to plateau, leading to very different fair values and conclusions about whether to own the stock today.
Do you think there's more to the story for ASICS? Head over to our Community to see what others are saying!
This article by Simply Wall St is general in nature. We provide commentary based on historical data and analyst forecasts only using an unbiased methodology and our articles are not intended to be financial advice. It does not constitute a recommendation to buy or sell any stock, and does not take account of your objectives, or your financial situation. We aim to bring you long-term focused analysis driven by fundamental data. Note that our analysis may not factor in the latest price-sensitive company announcements or qualitative material. Simply Wall St has no position in any stocks mentioned.
Have feedback on this article? Concerned about the content? Get in touch with us directly. Alternatively, email editorial-team@simplywallst.com