
Has Alibaba’s 2024 Share Price Surge Already Reflected its Rebound Story?
- If you are wondering whether Alibaba Group Holding is still a bargain after its big rebound in 2024, you are not alone. This article will walk you through what the current price might really be saying.
- After a tough few years, the stock is now up 83.3% year to date and 80.2% over the last 12 months, even though it has dipped slightly in the past week and month.
- Sentiment has been helped by Beijing rolling out more market friendly policies and easing some of the tightest tech regulations, plus renewed optimism around Chinese consumer spending and AI investment across Alibaba's ecosystem. At the same time, lingering worries about China macro risks and competition in e commerce and cloud have kept many investors cautious, rather than fully piling back in.
- On our checklist of six valuation tests, Alibaba scores a full 6/6. This strongly hints at undervaluation but does not tell the whole story. Next, we will unpack the different valuation approaches behind that score and then finish with a more powerful way to make sense of what the market might be missing.
Approach 1: Alibaba Group Holding Discounted Cash Flow (DCF) Analysis
A Discounted Cash Flow model estimates what a business is worth today by projecting the cash it can generate in the future and discounting those cash flows back to the present. For Alibaba Group Holding, this uses a 2 Stage Free Cash Flow to Equity approach, based on cash flow projections rather than accounting earnings.
Alibaba most recently generated roughly CN¥50.9 billion in free cash flow, and analysts expect this to rise over time as the business scales and margins improve. By 2029, free cash flow is projected to reach about CN¥190.4 billion, with further growth extrapolated by Simply Wall St out to 2035 using gradually slowing growth rates.
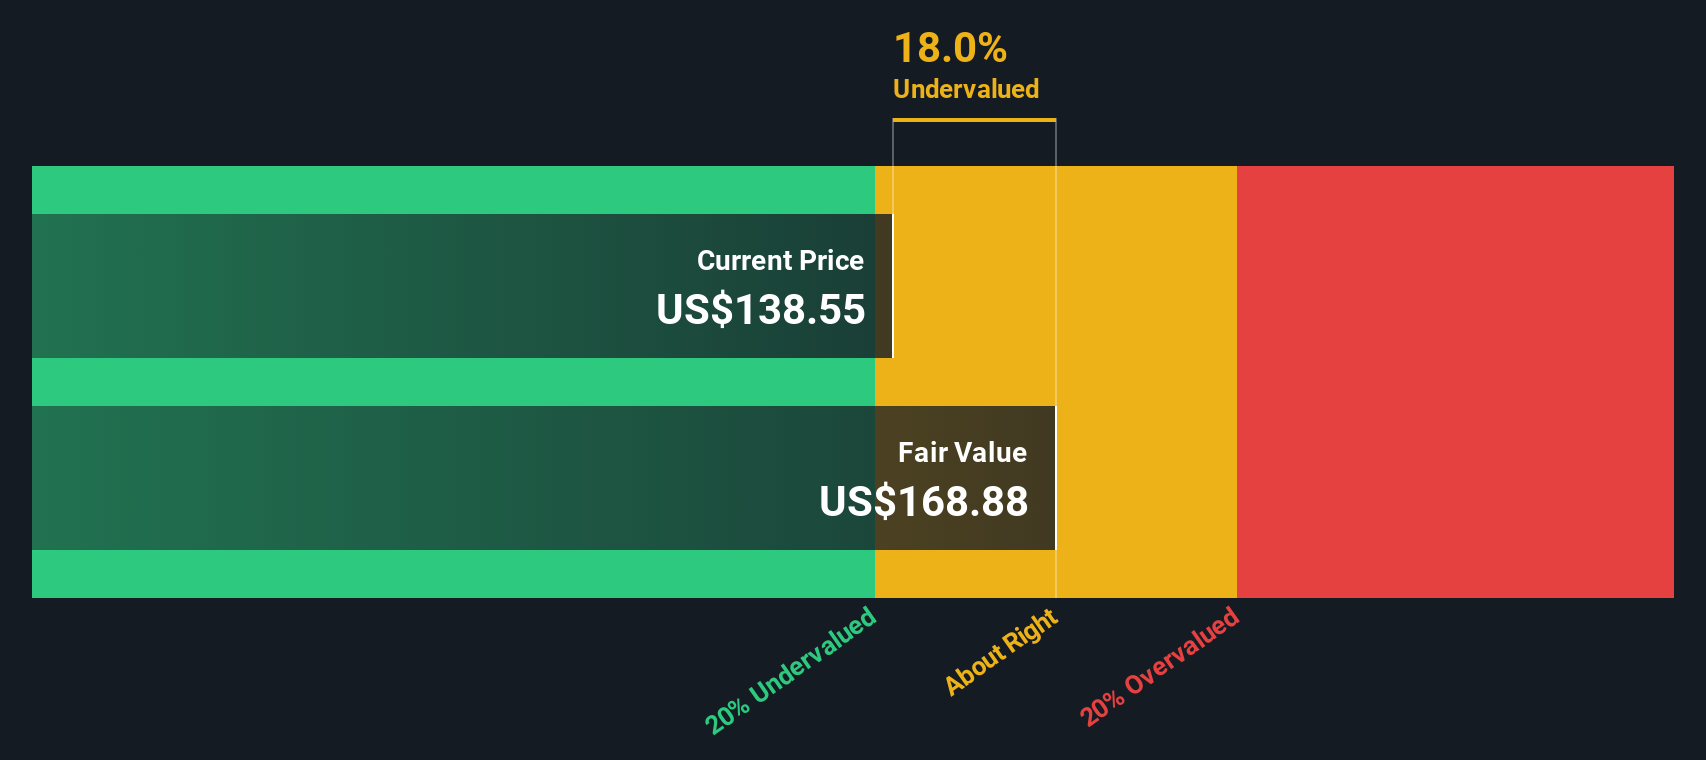
When all these future cash flows are discounted back, the intrinsic value comes out at about $267.61 per share, implying the stock is trading at a 41.8% discount to its estimated fair value. That indicates a margin of safety for long-term investors who believe these cash flow assumptions are broadly reasonable.
Result: UNDERVALUED
Our Discounted Cash Flow (DCF) analysis suggests Alibaba Group Holding is undervalued by 41.8%. Track this in your watchlist or portfolio, or discover 907 more undervalued stocks based on cash flows.
Approach 2: Alibaba Group Holding Price vs Earnings
For a profitable company like Alibaba, the price to earnings ratio is a useful snapshot of how much investors are paying for each dollar of current profits. Higher growth and lower perceived risk usually justify a higher PE, while slower growth or elevated risks tend to pull a fair multiple down.
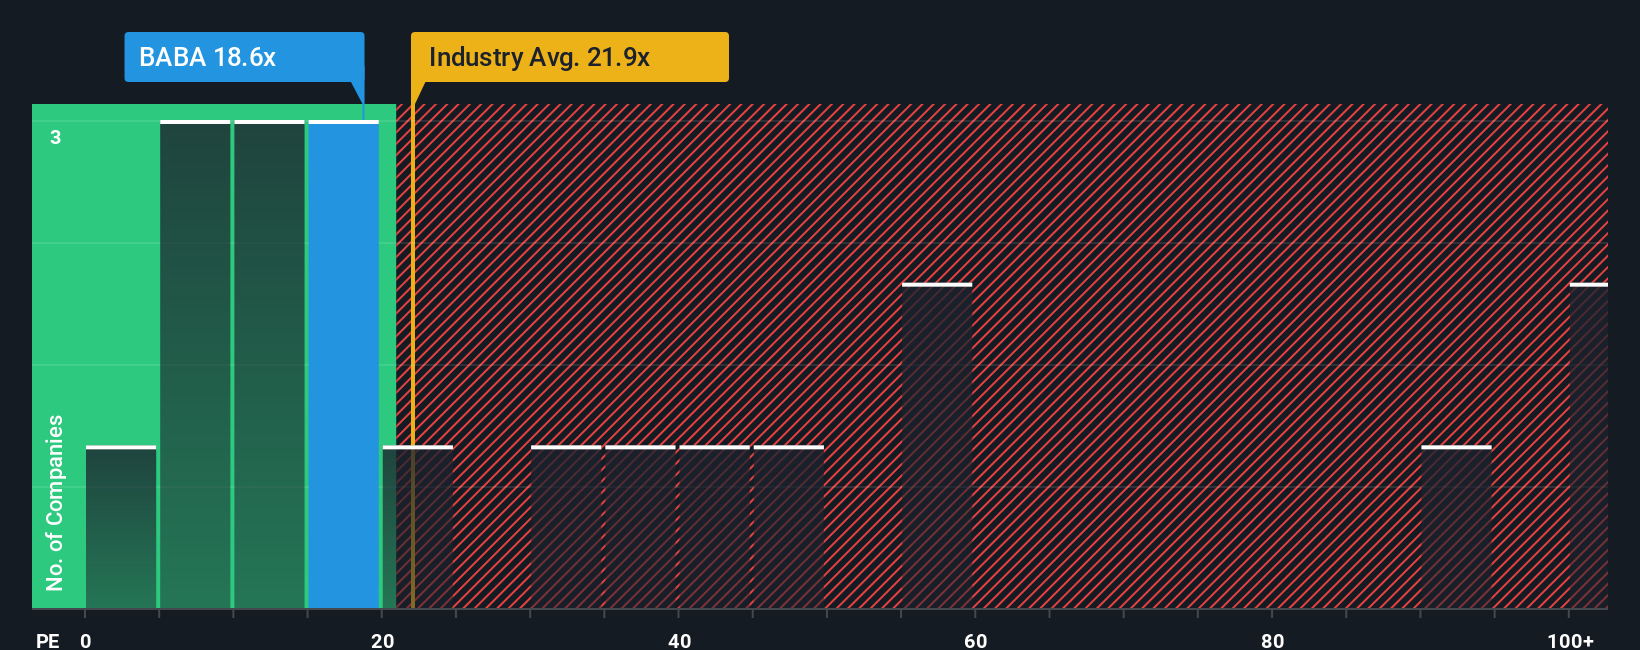
Alibaba currently trades on a PE of about 19.6x. That is roughly in line with the wider Multiline Retail industry average of about 19.7x, but it sits at a discount to the broader peer group, which averages around 36.0x. On the surface, that suggests investors are still applying a noticeable China and regulatory discount compared to global peers with similar business models.
Simply Wall St also calculates a proprietary Fair Ratio of 30.7x for Alibaba, based on its earnings growth outlook, margins, industry, market cap, and risk profile. This can be more informative than a simple peer or industry comparison because it adjusts for Alibaba’s specific fundamentals rather than assuming it should trade like a typical retailer or tech stock. With the shares on 19.6x versus a Fair Ratio of 30.7x, the valuation appears low relative to the company’s current earnings.
Result: Potentially undervalued based on this metric
PE ratios tell one story, but what if the real opportunity lies elsewhere? Discover 1448 companies where insiders are betting big on explosive growth.
Upgrade Your Decision Making: Choose your Alibaba Group Holding Narrative
Earlier we mentioned that there is an even better way to understand valuation, so let us introduce you to Narratives, an easy tool on Simply Wall St’s Community page that lets you turn your view of a company into a clear story linked to a financial forecast and a fair value estimate. Instead of only looking at today’s multiples, you specify assumptions for Alibaba Group Holding’s future revenue, earnings and margins, see what you think the shares are really worth, and then compare that Fair Value to the current Price to decide whether it is a buy, hold or sell. Because Narratives are updated dynamically as fresh news and earnings arrive, they stay relevant over time. You can also see how different investors view the same stock. For example, one Narrative might take a more cautious stance with a fair value of about $107 per share due to macro and regulatory risks, while another more optimistic Narrative might land closer to $198 per share on the belief that cloud and AI can drive stronger, higher quality growth.
For Alibaba Group Holding, however, we will make it really easy for you with previews of two leading Alibaba Group Holding Narratives:
🐂 Alibaba Group Holding Bull Case
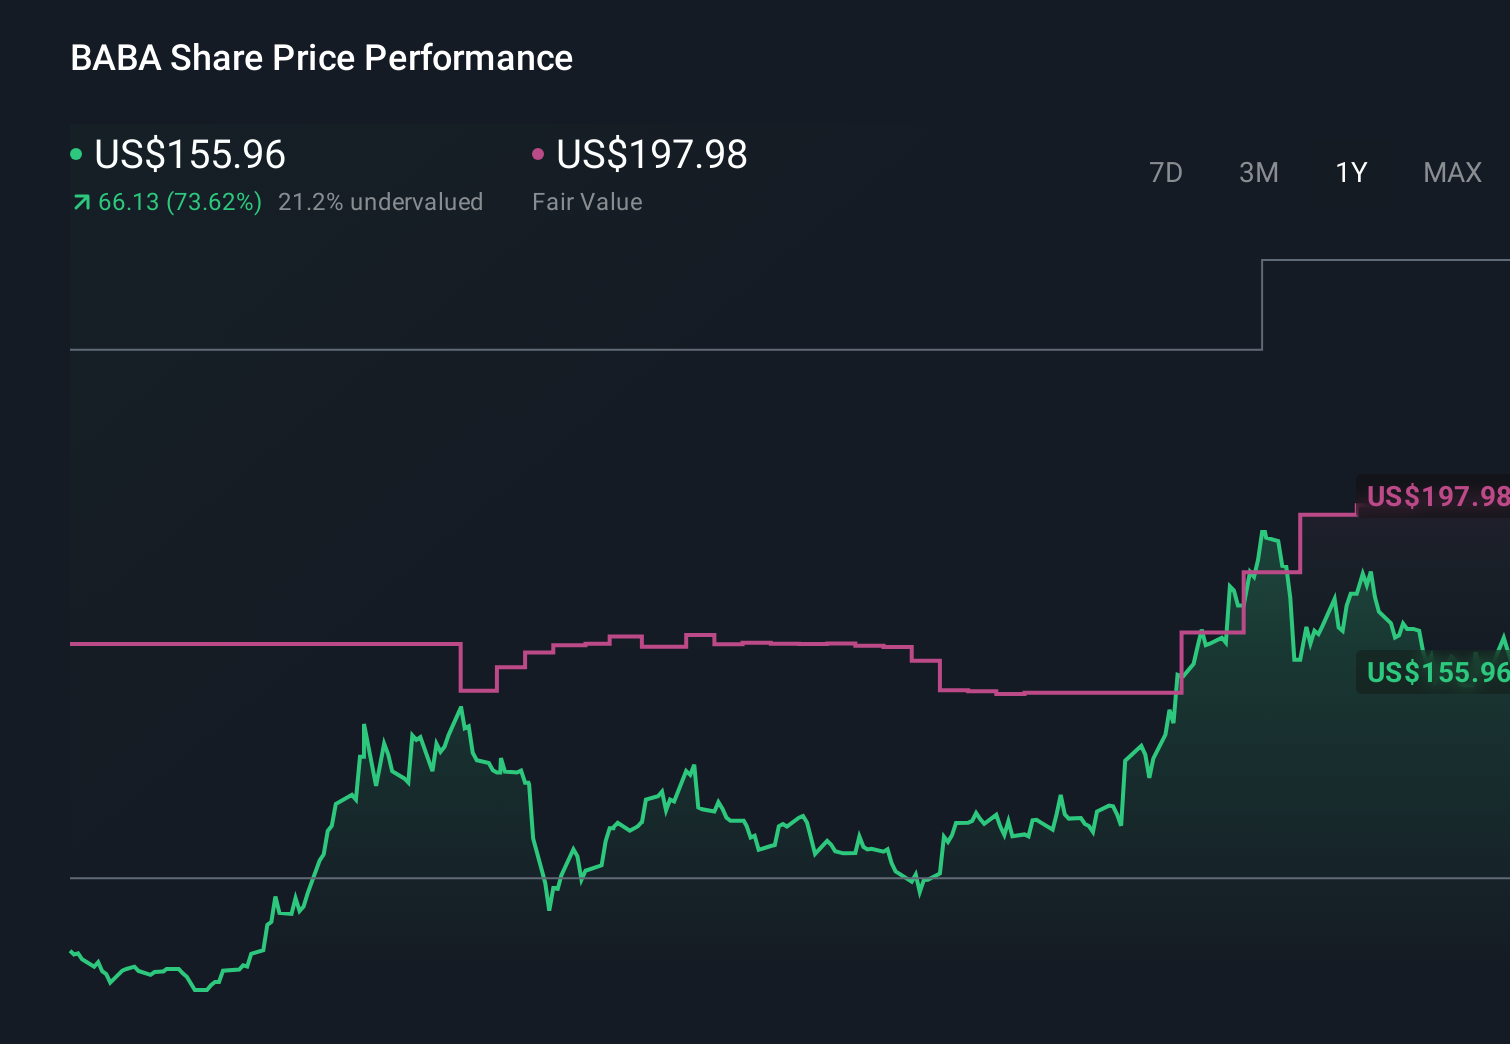
Fair value: $197.98 per share
Implied undervaluation: 21.4%
Forecast revenue growth: 9.34%
- Analysts expect Alibaba's heavy investment in AI, cloud and quick commerce to accelerate long term revenue growth and gradually lift margins as scale benefits kick in.
- Partnerships, open sourced AI models and tighter integration across e commerce, local services and loyalty programs are seen as deepening Alibaba's ecosystem and enterprise reach.
- Consensus assumes earnings rise to around CN¥171.1 billion by 2028, with the stock re rating to a higher but still reasonable forward PE multiple to justify a fair value near $198.
🐻 Alibaba Group Holding Bear Case
Fair value: $107.09 per share
Implied overvaluation: 45.4%
Forecast revenue growth: 14.12%
- Using a DCF built on $15 billion in normalized free cash flow and an 8% fading to 2.5% long run growth path, this view arrives at a fair value around $107 per share.
- The narrative flags macro and geopolitical risks including US China tensions, regulatory pressure, intense AI and cloud competition and FX headwinds as key constraints on upside.
- While acknowledging strong AI and cloud momentum and solid cash generation, it argues that the current share price already discounts near term growth and leaves limited margin of safety.
Do you think there's more to the story for Alibaba Group Holding? Head over to our Community to see what others are saying!
This article by Simply Wall St is general in nature. We provide commentary based on historical data and analyst forecasts only using an unbiased methodology and our articles are not intended to be financial advice. It does not constitute a recommendation to buy or sell any stock, and does not take account of your objectives, or your financial situation. We aim to bring you long-term focused analysis driven by fundamental data. Note that our analysis may not factor in the latest price-sensitive company announcements or qualitative material. Simply Wall St has no position in any stocks mentioned.
Have feedback on this article? Concerned about the content? Get in touch with us directly. Alternatively, email editorial-team@simplywallst.com