
Has Siemens Energy’s 615% Three Year Rally in 2025 Run Ahead of Fundamentals?
- If you are wondering whether Siemens Energy is still a smart buy after its big rebound, or if you are already late to the party, this breakdown will help you separate genuine value from hype.
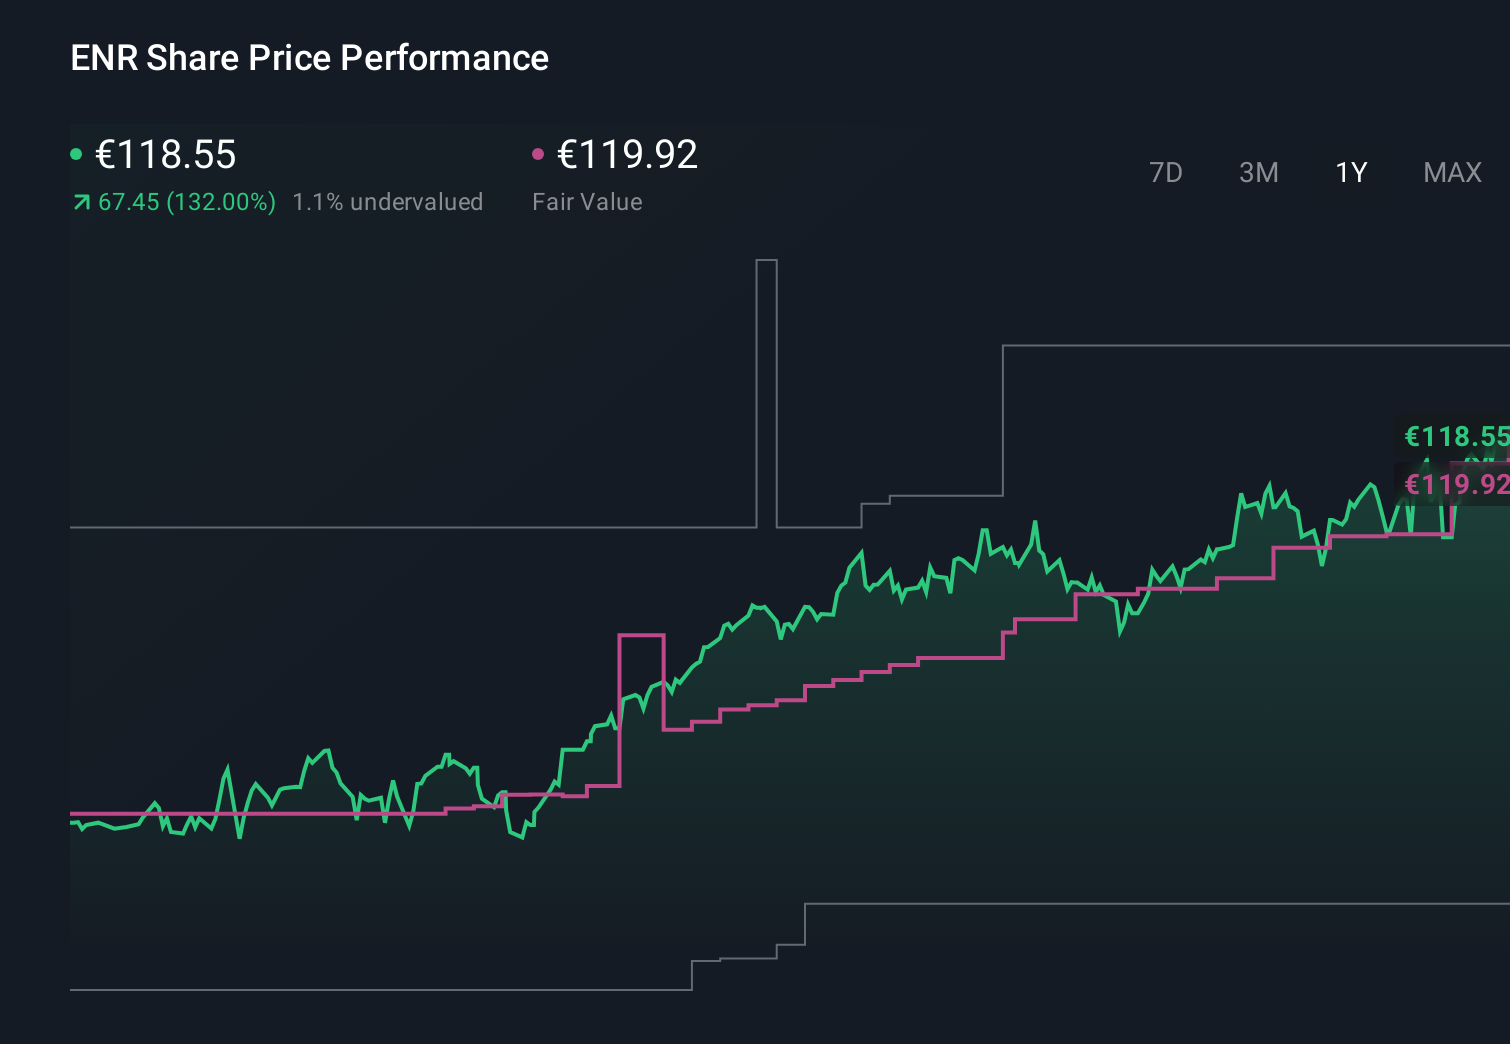
- The stock has climbed 1.0% over the last week, 10.4% over the past month, and 133.2% year to date, resulting in a 142.5% gain over 1 year and 615.2% over 3 years.
- Much of this momentum has been driven by ongoing restructuring efforts and investor optimism around stabilising its troubled wind business, as Siemens Energy works to de‑risk its portfolio and tighten capital discipline. At the same time, the market has been responding to broader energy transition tailwinds, which have helped shift sentiment from crisis mode to cautious optimism.
- Despite that excitement, Siemens Energy currently scores just 0/6 on our undervaluation checks. We will walk through what traditional valuation methods say about the stock, then finish by looking at a more holistic way to judge whether the current price makes sense.
Siemens Energy scores just 0/6 on our valuation checks. See what other red flags we found in the full valuation breakdown.
Approach 1: Siemens Energy Discounted Cash Flow (DCF) Analysis
A Discounted Cash Flow (DCF) model estimates what a company is worth by projecting its future cash flows and then discounting them back to today, reflecting the time value and risk of that money.
For Siemens Energy, the model uses a 2 Stage Free Cash Flow to Equity approach based on its latest twelve month free cash flow of about €4.15 billion. Analyst forecasts and subsequent extrapolations by Simply Wall St see free cash flow remaining in the billions of euros through the early 2030s, before gradually easing toward roughly €0.88 billion by 2035. These projections are all converted into today s money using a discount rate to reflect risk and required return.
Bringing all those discounted cash flows together, the DCF model arrives at an intrinsic value of about €29.18 per share. Compared with the current share price, this implies the stock is around 306.3% overvalued, suggesting that recent optimism has pushed the valuation well beyond what cash flow fundamentals support.
Result: OVERVALUED
Our Discounted Cash Flow (DCF) analysis suggests Siemens Energy may be overvalued by 306.3%. Discover 907 undervalued stocks or create your own screener to find better value opportunities.

Approach 2: Siemens Energy Price vs Earnings
For a company that has moved back into profitability, the price to earnings, or PE, ratio is a useful way to judge whether investors are paying a reasonable price for each euro of earnings. In general, faster growing and lower risk businesses can justify higher PE ratios, while slower or riskier companies typically deserve lower ones.
Siemens Energy currently trades on a PE of about 71.4x, which is well above both the Electrical industry average of roughly 29.6x and the peer group average of around 49.9x. On the surface, that suggests the market is paying a steep premium for its earnings, likely reflecting optimism about a turnaround and long term demand for energy transition infrastructure.
Simply Wall St s Fair Ratio framework goes a step further than simple peer or industry comparisons. It estimates what a reasonable PE should be, given Siemens Energy s specific growth outlook, risk profile, profit margins, industry positioning and market cap. For Siemens Energy, the Fair Ratio is 47.2x, meaning the current 71.4x multiple sits well above what these fundamentals justify, pointing to a valuation that still looks stretched on an earnings basis.
Result: OVERVALUED

PE ratios tell one story, but what if the real opportunity lies elsewhere? Discover 1448 companies where insiders are betting big on explosive growth.
Upgrade Your Decision Making: Choose your Siemens Energy Narrative
Earlier we mentioned that there is an even better way to understand valuation, so let us introduce you to Narratives. This is a simple framework on Simply Wall St s Community page that lets you connect your own story about Siemens Energy to a set of explicit assumptions about its future revenue, earnings and margins. It then translates those into a dynamic financial forecast and fair value, and allows you to compare that evolving fair value with today s price to decide whether to buy, hold or sell. The Narrative automatically updates as new news, earnings or guidance arrive. One investor might, for example, build a bullish Siemens Energy Narrative around strong grid and gas growth, improving margins and a fair value closer to €136. Another investor might take a more cautious view focused on execution risks and cap their fair value nearer €37. Both perspectives are made transparent, comparable and easy to adjust over time.
Do you think there's more to the story for Siemens Energy? Head over to our Community to see what others are saying!
This article by Simply Wall St is general in nature. We provide commentary based on historical data and analyst forecasts only using an unbiased methodology and our articles are not intended to be financial advice. It does not constitute a recommendation to buy or sell any stock, and does not take account of your objectives, or your financial situation. We aim to bring you long-term focused analysis driven by fundamental data. Note that our analysis may not factor in the latest price-sensitive company announcements or qualitative material. Simply Wall St has no position in any stocks mentioned.
Have feedback on this article? Concerned about the content? Get in touch with us directly. Alternatively, email editorial-team@simplywallst.com