
Does Circle Stock Offer Value After Recent Volatility and USDC Growth Prospects in 2025?
- Wondering if Circle Internet Group is quietly becoming a bargain or just fairly priced at current levels? This breakdown is designed to help you figure out whether the stock deserves a place on your watchlist.
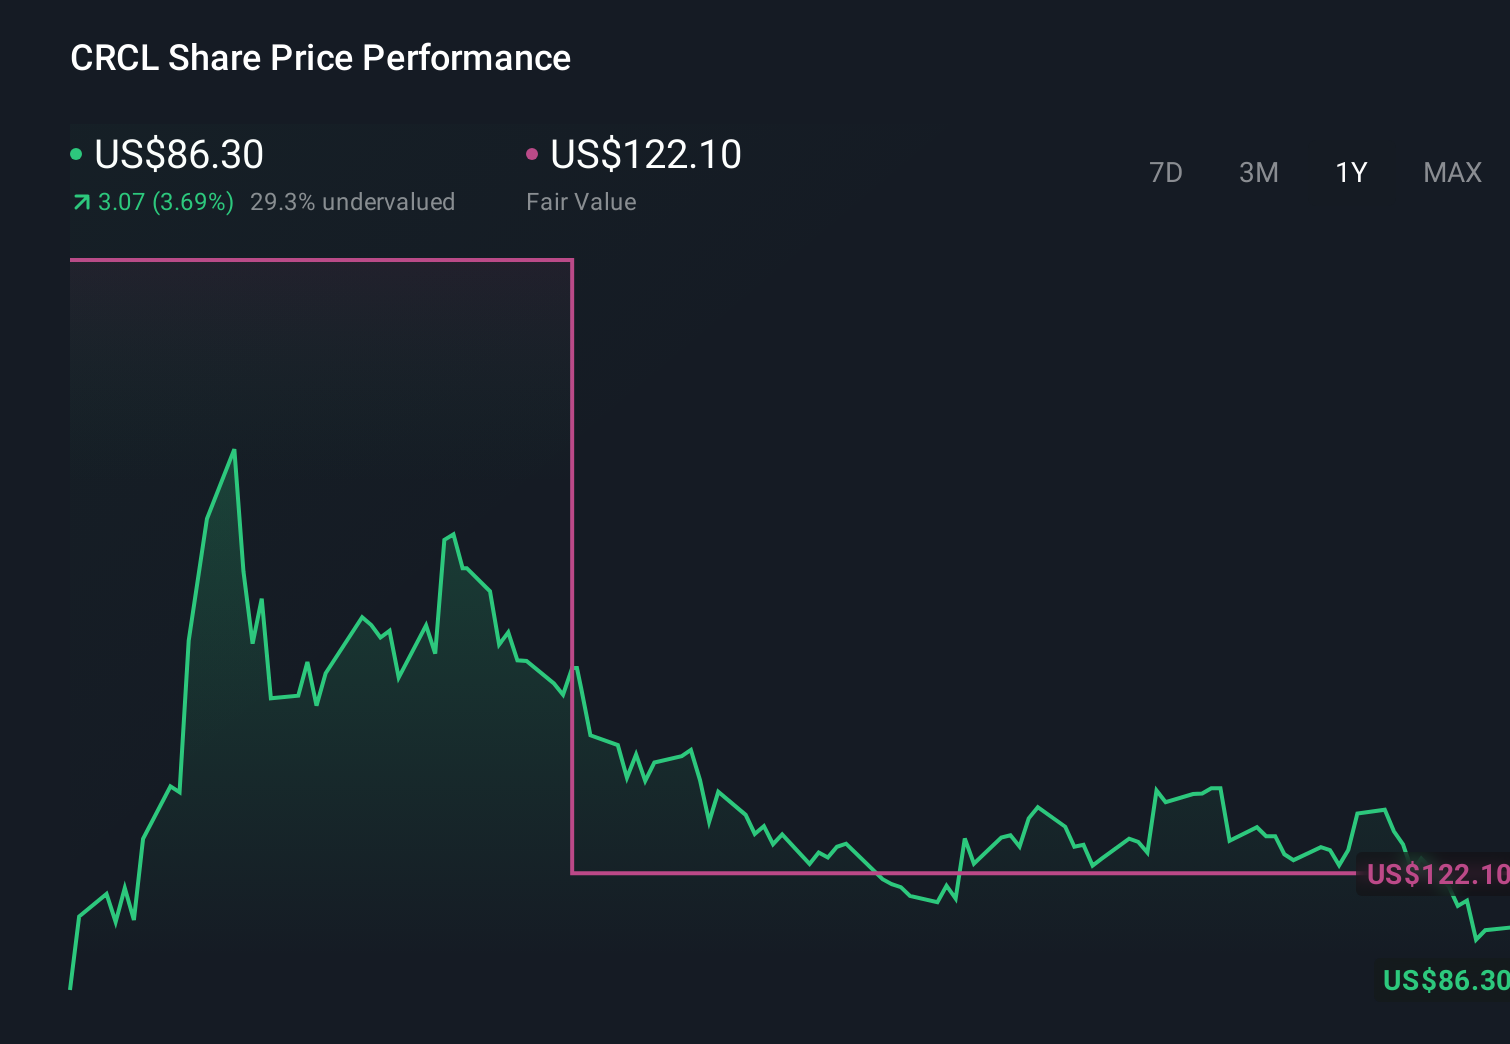
- The shares have been choppy lately, slipping about 2.5% over the last week and 3.3% in the past month, while still managing to sit roughly flat year to date at 0.3%. This hints that the market is still deciding how to price its long term story.
- Recent headlines around Circle have largely focused on its role in the broader digital assets ecosystem and the strategic positioning of its USDC stablecoin. This keeps the company in the spotlight whenever regulation or crypto infrastructure is in the news. This steady news flow helps explain why sentiment can swing quickly, even when the fundamentals change more slowly.
- Right now, Circle Internet Group scores a 3/6 valuation check score. This suggests parts of the market may be underestimating its value while other areas look more fully priced. Next, we will unpack the main valuation approaches before circling back to an even more insightful way to think about what the stock is truly worth.
Approach 1: Circle Internet Group Discounted Cash Flow (DCF) Analysis
A Discounted Cash Flow, or DCF, model estimates what a business is worth by projecting the cash it can generate in the future and then discounting those cash flows back to today. For Circle Internet Group, the model is a 2 Stage Free Cash Flow to Equity approach, using cash flow projections in $ and adjusting for risk over time.
The latest twelve month free cash flow sits at about $329.2 Million, and analysts expect this to grow strongly, with Simply Wall St extending their views beyond the analyst window. Their projections see annual free cash flow rising toward roughly $2.1 Billion by 2035, reflecting a steep growth trajectory as Circle scales its stablecoin and broader platform.
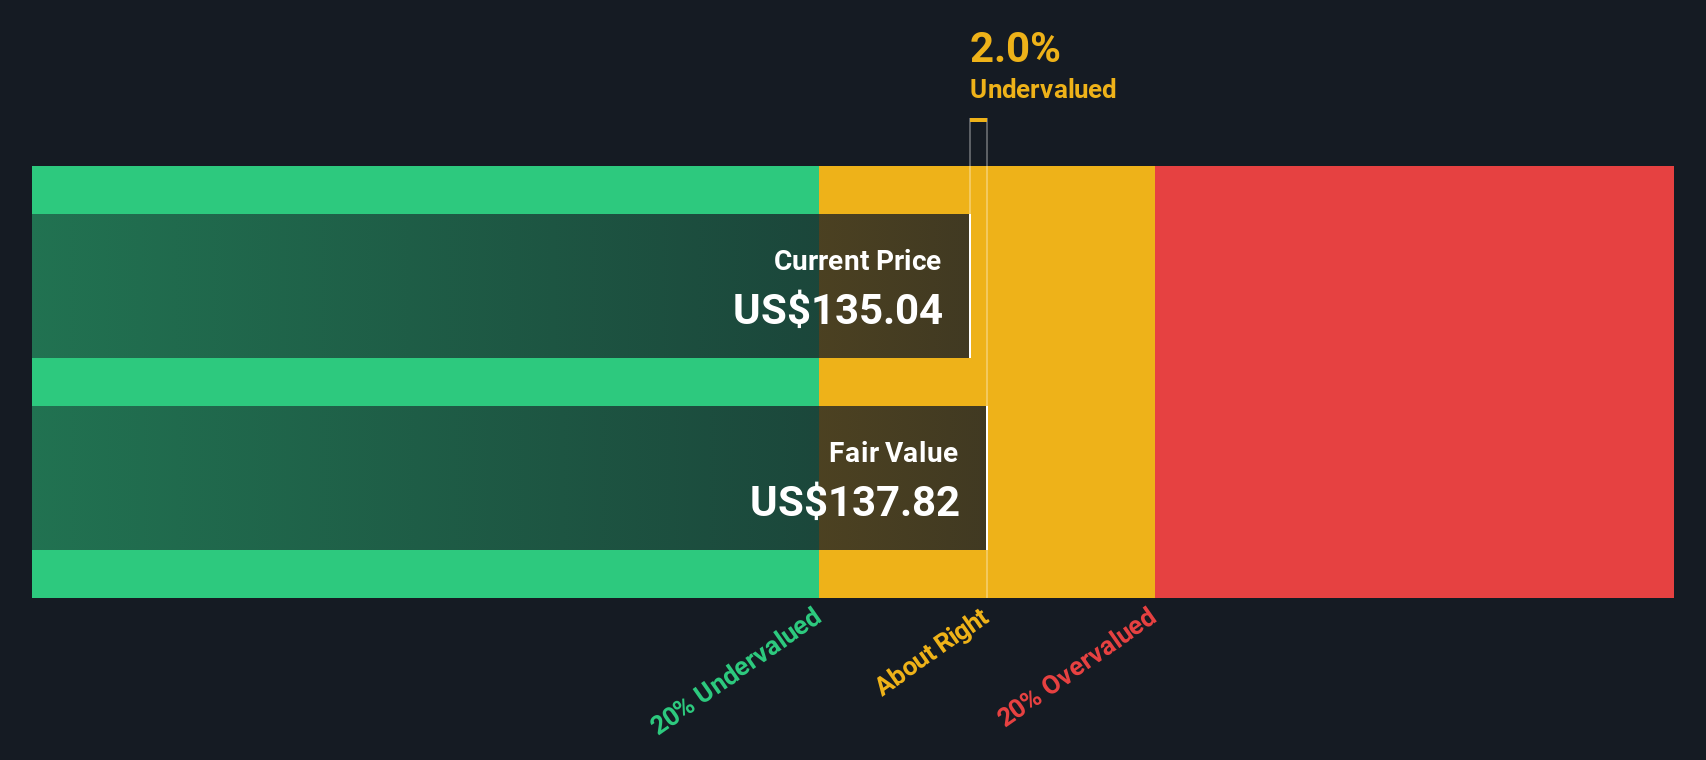
Based on these projections, the DCF model arrives at an intrinsic value of about $111.52 per share. Compared with the current market price, this implies the stock trades at a 25.2% discount, suggesting investors are not fully pricing in Circle’s long term cash generation potential.
Result: UNDERVALUED
Our Discounted Cash Flow (DCF) analysis suggests Circle Internet Group is undervalued by 25.2%. Track this in your watchlist or portfolio, or discover 907 more undervalued stocks based on cash flows.
Approach 2: Circle Internet Group Price vs Sales
For growing software and fintech businesses that are not yet focused on maximizing profits, the price to sales ratio is often a better valuation yardstick than earnings based measures. Revenue tends to be more stable than short term profit swings, so it can give a clearer view of how the market values each dollar of Circle Internet Group sales.
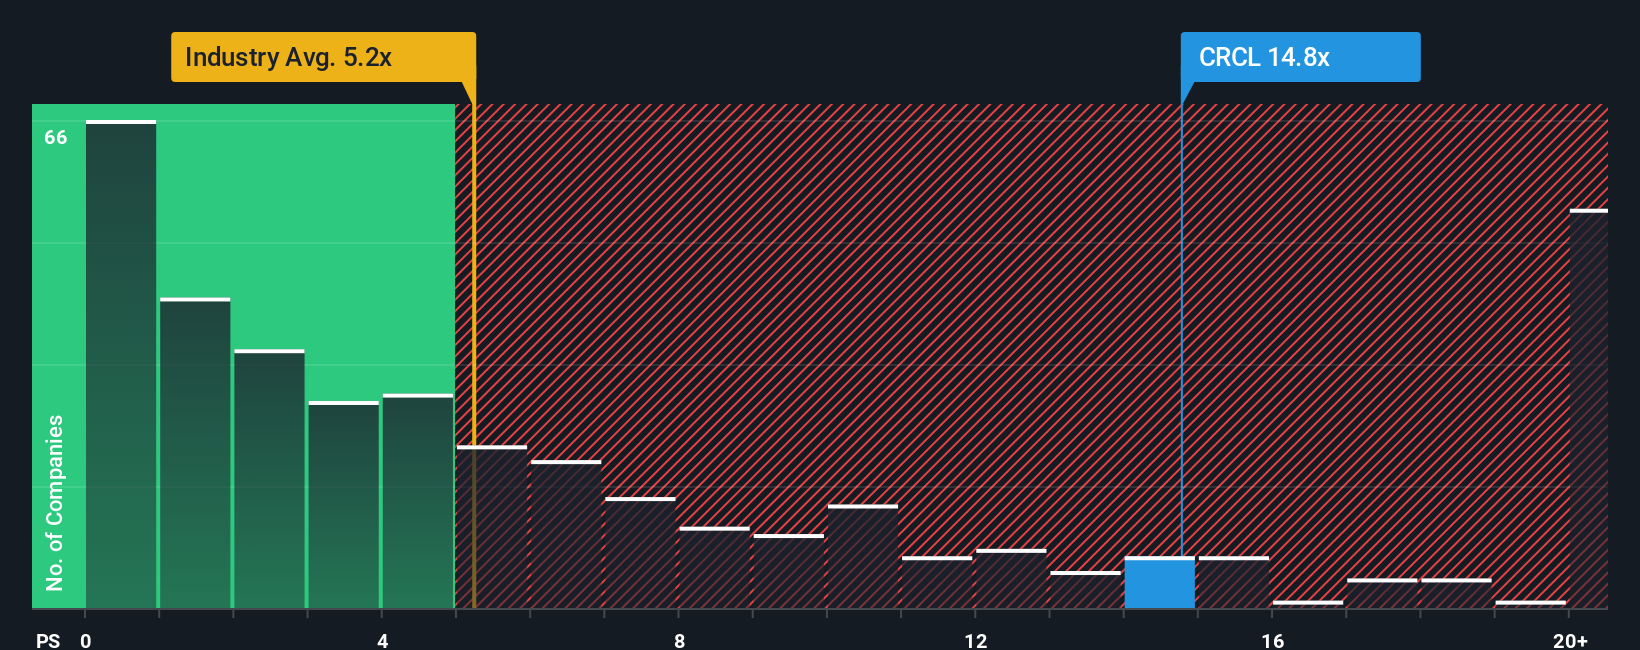
In general, faster growth and lower risk justify a higher sales multiple, while slower growth and higher uncertainty call for a lower one. Circle currently trades at about 8.15x sales. That is above the broader Software industry average of roughly 4.94x, but below the peer group average near 10.92x, suggesting investors are willing to pay a premium to the sector, yet still apply a discount versus closer comparables.
Simply Wall St’s Fair Ratio framework goes a step further by estimating the multiple Circle should command based on its own growth outlook, profitability profile, risk factors, industry and market cap. For Circle, this proprietary model points to a fair price to sales ratio of about 4.34x, comfortably below the current 8.15x level, which implies the shares are pricing in more optimism than the fundamentals justify at the moment.
Result: OVERVALUED
PS ratios tell one story, but what if the real opportunity lies elsewhere? Discover 1448 companies where insiders are betting big on explosive growth.
Upgrade Your Decision Making: Choose Your Circle Internet Group Narrative
Earlier we mentioned that there is an even better way to understand valuation, so let us introduce you to Narratives, which are simply the stories investors tell about a company that sit behind the numbers they plug in for fair value, future revenue, earnings and margins.
A Narrative connects what you believe about Circle Internet Group, its competitive position, regulation and growth opportunities to a specific financial forecast and then to an explicit fair value estimate.
On Simply Wall St, Narratives are an easy, accessible tool found on the Community page, where many investors share how their view of a company translates into forecasts, fair value and a clear stance by comparing that fair value to the current market price.
Because Narratives are dynamically updated when new information such as earnings, news or regulatory changes arrives, they help you decide when your thesis is strengthening, breaking, or simply getting ahead of itself, so you can adjust your timing instead of reacting emotionally.
For example, some Circle Narratives currently assume robust stablecoin adoption and assign fair value well above the present price, while more cautious Narratives, focused on rate cuts and regulatory constraints, sit meaningfully below today’s level, illustrating how different perspectives can coexist on the same stock.
Do you think there's more to the story for Circle Internet Group? Head over to our Community to see what others are saying!
This article by Simply Wall St is general in nature. We provide commentary based on historical data and analyst forecasts only using an unbiased methodology and our articles are not intended to be financial advice. It does not constitute a recommendation to buy or sell any stock, and does not take account of your objectives, or your financial situation. We aim to bring you long-term focused analysis driven by fundamental data. Note that our analysis may not factor in the latest price-sensitive company announcements or qualitative material. Simply Wall St has no position in any stocks mentioned.
Have feedback on this article? Concerned about the content? Get in touch with us directly. Alternatively, email editorial-team@simplywallst.com