
Is CoreCivic’s Valuation Attractive After Recent Share Price Rebound in 2025?
- If you have ever wondered whether CoreCivic is quietly trading below what it is really worth, you are not alone and this article is going to walk through that question step by step.
- Despite being down 13.0% year to date and 13.6% over the last year, the stock has climbed 10.7% in the last month and 155.4% over five years, which reflects how quickly the market can move when expectations change.
- Recently, investors have been focused on CoreCivic's position in the U.S. corrections and detention system, especially around contract renewals and shifting government priorities for private facilities. There has also been ongoing discussion about how immigration policy, criminal justice reform, and public sector budget constraints could reshape demand for CoreCivic's services over the long term.
- Right now, CoreCivic scores a 6/6 on our valuation checks, suggesting it screens as undervalued across all the measures we use. Next, we will unpack those methods, then finish with a way to think about what “fair value” really means for this business.
Find out why CoreCivic's -13.6% return over the last year is lagging behind its peers.
Approach 1: CoreCivic Discounted Cash Flow (DCF) Analysis
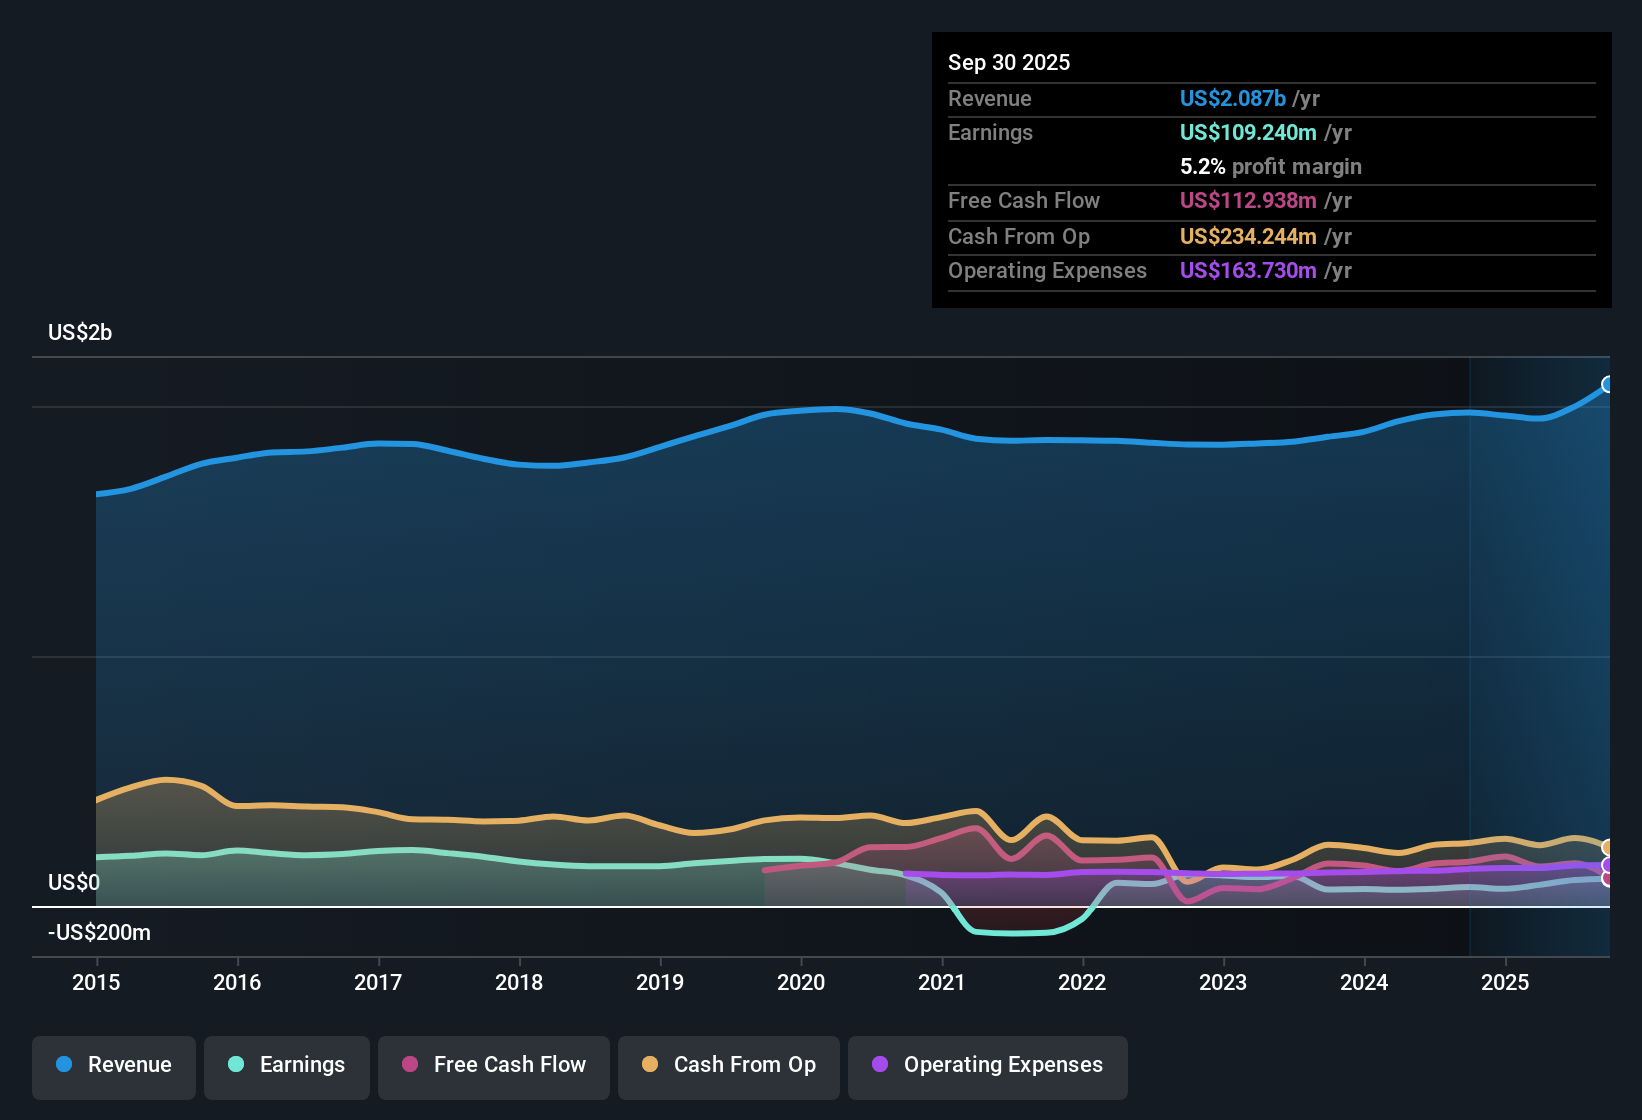
A Discounted Cash Flow, or DCF, model estimates what a company is worth today by projecting its future cash flows and then discounting them back into today’s dollars. For CoreCivic, the model uses a 2 Stage Free Cash Flow to Equity approach, starting from last twelve months free cash flow of about $139 million and then applying gradually changing growth assumptions over time.
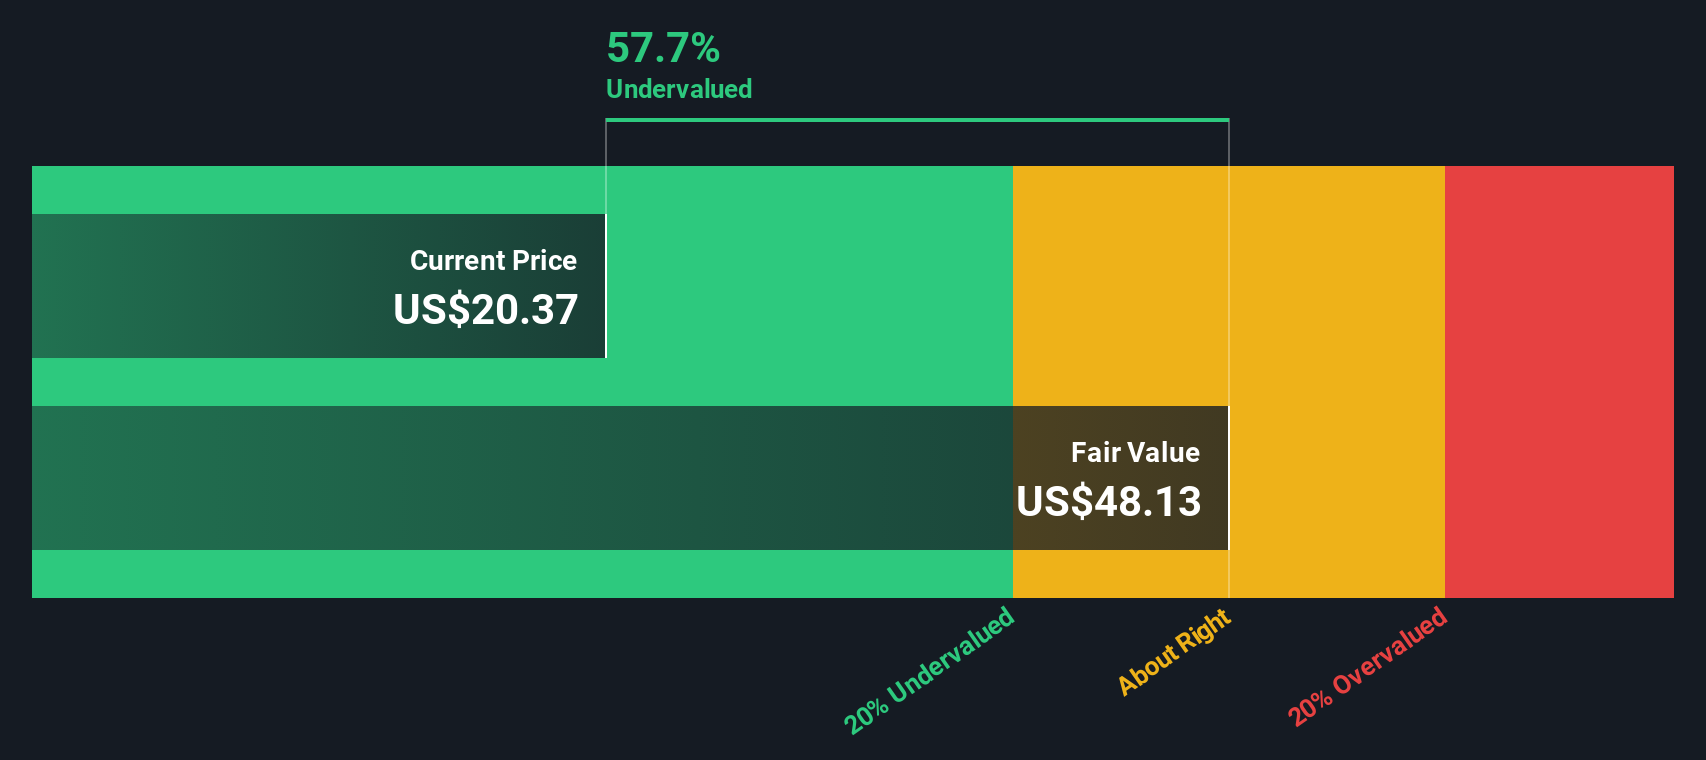
Using analyst forecasts where available and extrapolating further years, Simply Wall St projects CoreCivic’s free cash flow to reach roughly $154 million in 2035, with modest declines and then low single digit growth along the way. All of these future cash flows are converted into present value in dollars, then summed to arrive at an estimated intrinsic value of about $24.50 per share.
Compared with the current share price, this implies the stock is trading at roughly a 22.9% discount to its DCF based fair value, which indicates investors may not be fully pricing in the company’s cash generation.
Result: UNDERVALUED
Our Discounted Cash Flow (DCF) analysis suggests CoreCivic is undervalued by 22.9%. Track this in your watchlist or portfolio, or discover 907 more undervalued stocks based on cash flows.
Approach 2: CoreCivic Price vs Earnings
For a profitable business like CoreCivic, the price to earnings, or PE, ratio is a useful way to gauge how much investors are willing to pay for each dollar of current earnings. In general, companies with stronger growth prospects or lower perceived risk tend to trade on higher PE multiples, while slower growth or higher risk usually warrants a lower, more conservative PE.
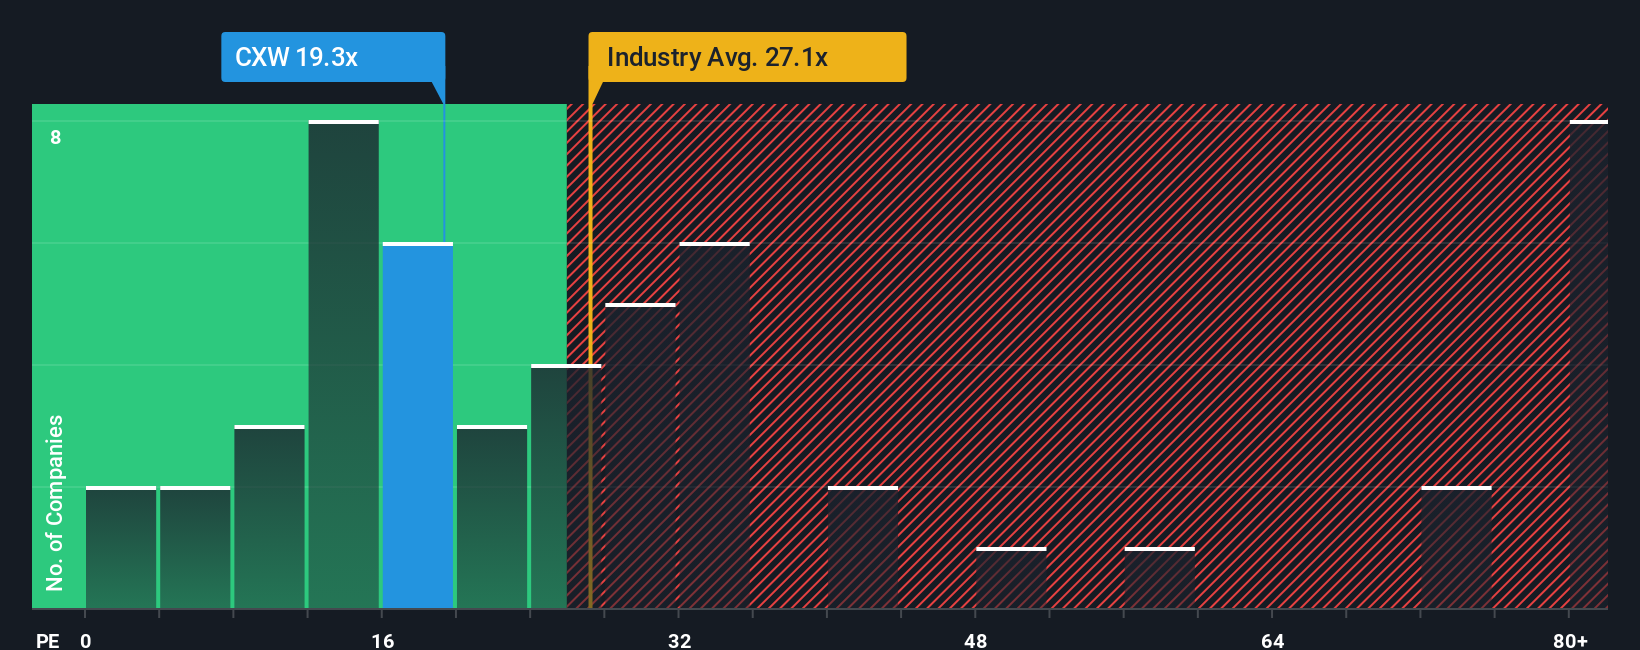
CoreCivic currently trades on a PE of about 18.1x, which is roughly in line with the peer average of 18.2x and below the broader Commercial Services industry average of 24.6x. To go a step further than simple comparisons, Simply Wall St also calculates a Fair Ratio, its proprietary estimate of what a reasonable PE should be after accounting for factors like CoreCivic’s earnings growth outlook, profit margins, industry dynamics, market cap and risk profile. This makes the Fair Ratio more tailored than a basic peer or industry check, which can be skewed by outliers or structural differences between businesses.
For CoreCivic, the Fair Ratio is 28.4x, notably higher than the current 18.1x, suggesting the market is pricing the stock below what its fundamentals might justify.
Result: UNDERVALUED
PE ratios tell one story, but what if the real opportunity lies elsewhere? Discover 1448 companies where insiders are betting big on explosive growth.
Upgrade Your Decision Making: Choose your CoreCivic Narrative
Earlier we mentioned that there is an even better way to understand valuation. Let us introduce you to Narratives, an easy tool on Simply Wall St’s Community page that lets you write the story behind your numbers by linking your assumptions about CoreCivic’s future revenue, earnings and margins to a forecast and then to a fair value estimate. This can help you decide when to buy or sell by comparing that Fair Value to today’s Price. The Narrative automatically updates as new news or earnings arrive so your view stays current. For example, one investor might build a bullish CoreCivic Narrative around surging detention funding, rapid facility reactivations and expanding margins that supports a higher fair value and a target closer to the most optimistic analyst at about $38.00 per share. Another, more cautious investor could focus on regulatory risk, ESG pressure and contract concentration, landing nearer the most conservative analyst view around $28.00. Yet both are using the same structured framework to turn a qualitative thesis into a clear, numbers-backed valuation.
Do you think there's more to the story for CoreCivic? Head over to our Community to see what others are saying!
This article by Simply Wall St is general in nature. We provide commentary based on historical data and analyst forecasts only using an unbiased methodology and our articles are not intended to be financial advice. It does not constitute a recommendation to buy or sell any stock, and does not take account of your objectives, or your financial situation. We aim to bring you long-term focused analysis driven by fundamental data. Note that our analysis may not factor in the latest price-sensitive company announcements or qualitative material. Simply Wall St has no position in any stocks mentioned.
Have feedback on this article? Concerned about the content? Get in touch with us directly. Alternatively, email editorial-team@simplywallst.com