
Is It Too Late To Consider China Unicom After Its Multi Year Share Price Surge?
- If you are wondering whether China Unicom (Hong Kong) still offers good value after a strong multi year run, or if most of the upside is already priced in, this article is for you.
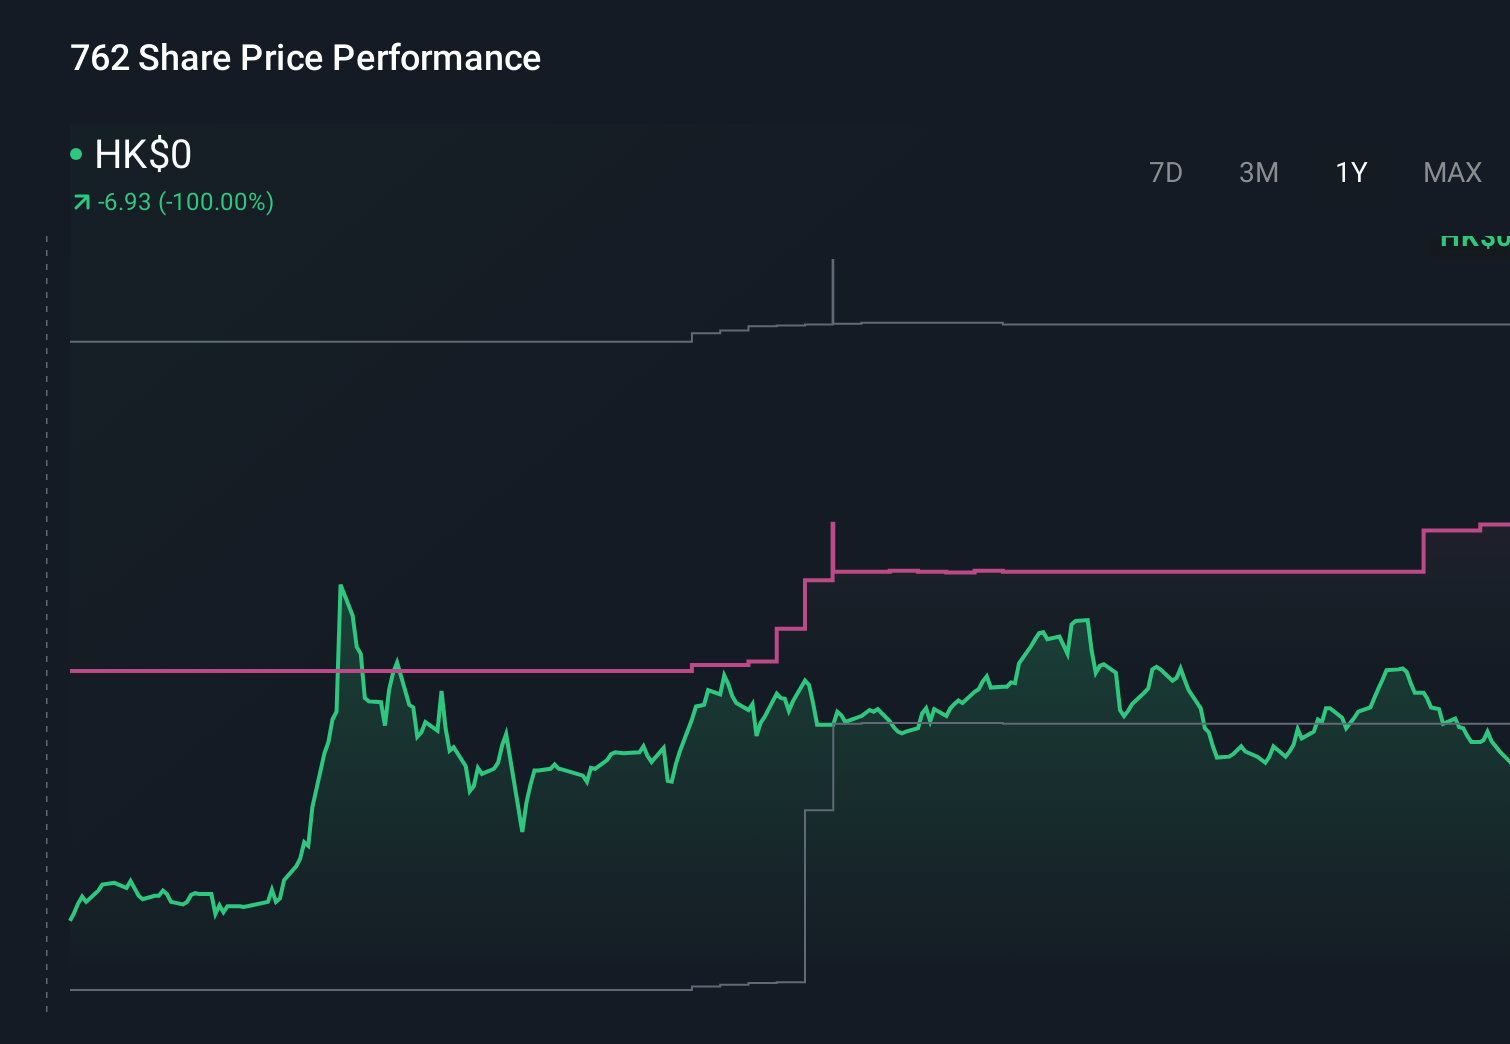
- The share price has pulled back recently, down 3.3% over the last week and 12.3% over the last month, but it is still up 19.1% year to date, 34.0% over 1 year, 123.3% over 3 years and 164.2% over 5 years.
- That kind of long term outperformance has been underpinned by Beijing's ongoing push for state owned telecoms to support digital infrastructure, along with a steady stream of announcements around 5G upgrades and industrial digitalization deals. Together, these themes have encouraged investors to rethink the growth profile and risk perception of the big Chinese telcos, China Unicom included.
- Despite the rally, China Unicom (Hong Kong) currently scores a 6/6 valuation check score. Next, we will break down what that means across different valuation methods, before circling back to a broader way of thinking about fair value at the end of the article.
Approach 1: China Unicom (Hong Kong) Discounted Cash Flow (DCF) Analysis
A Discounted Cash Flow model estimates what a business is worth by projecting its future cash flows and then discounting them back to today, to reflect risk and the time value of money.
For China Unicom (Hong Kong), the model starts with last twelve month free cash flow of about CN¥11.6 billion and uses analyst forecasts for the next few years. It then extrapolates further out based on Simply Wall St assumptions. By 2035, free cash flow is projected to be around CN¥38.1 billion, with the path between driven by modest growth followed by a gradual slowdown as the business matures.
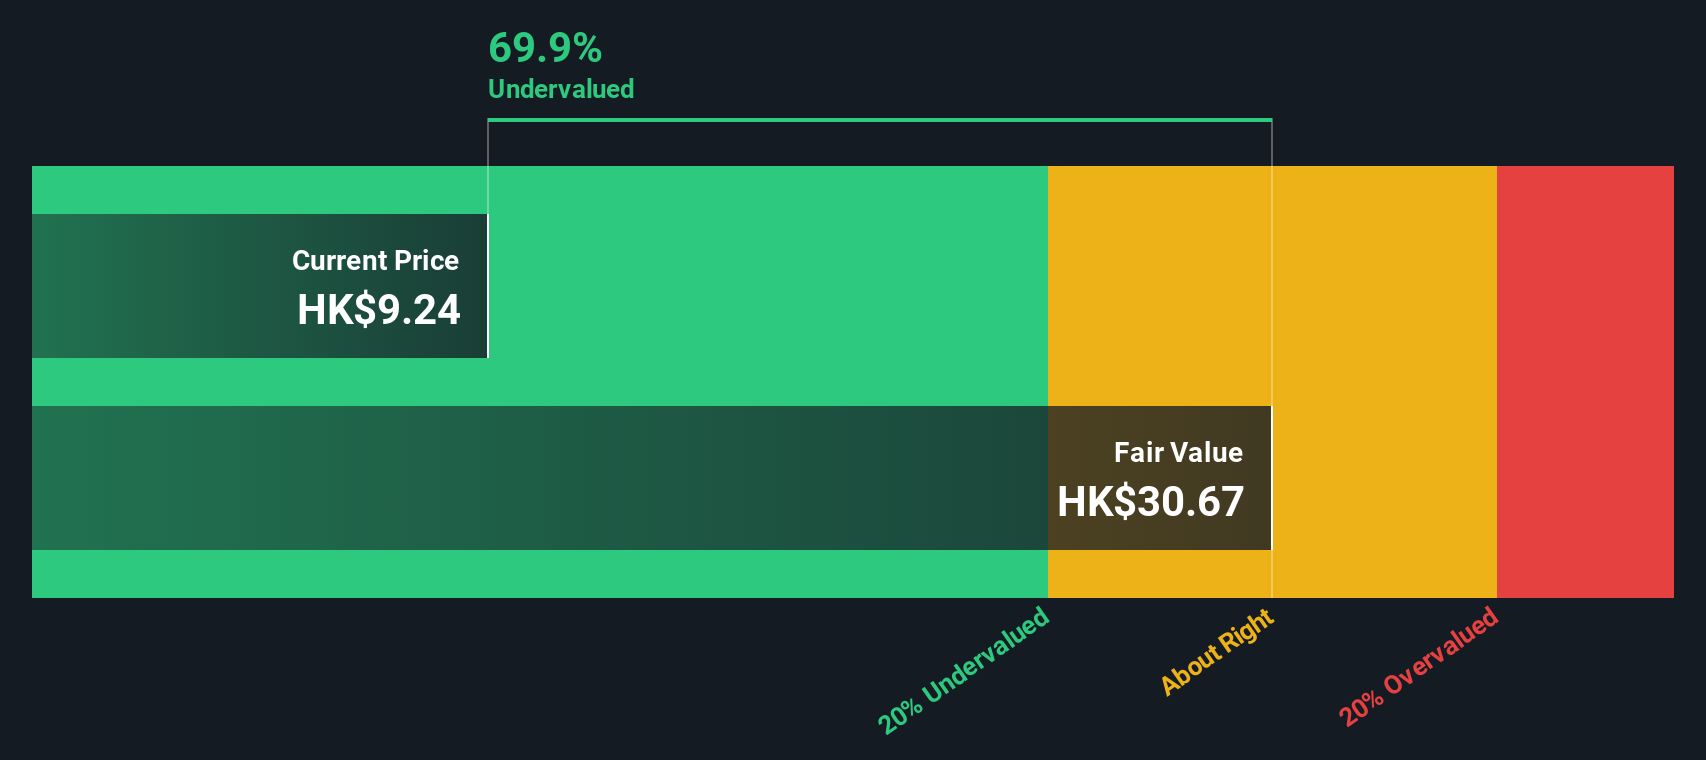
Adding up all these discounted cash flows under the 2 Stage Free Cash Flow to Equity model gives an estimated intrinsic value of roughly HK$27.06 per share. Compared to the current market price, this implies the stock is about 68.2% undervalued, suggesting investors are paying well below the modelled long term cash generation of the company.
Result: UNDERVALUED
Our Discounted Cash Flow (DCF) analysis suggests China Unicom (Hong Kong) is undervalued by 68.2%. Track this in your watchlist or portfolio, or discover 907 more undervalued stocks based on cash flows.
Approach 2: China Unicom (Hong Kong) Price vs Earnings
For a consistently profitable business like China Unicom (Hong Kong), the price to earnings, PE, ratio is a useful way to gauge how much investors are paying for each dollar of current earnings. In general, companies with stronger growth prospects and lower perceived risk can justify a higher PE, while slower growth or higher risk should translate into a lower, more cautious multiple.
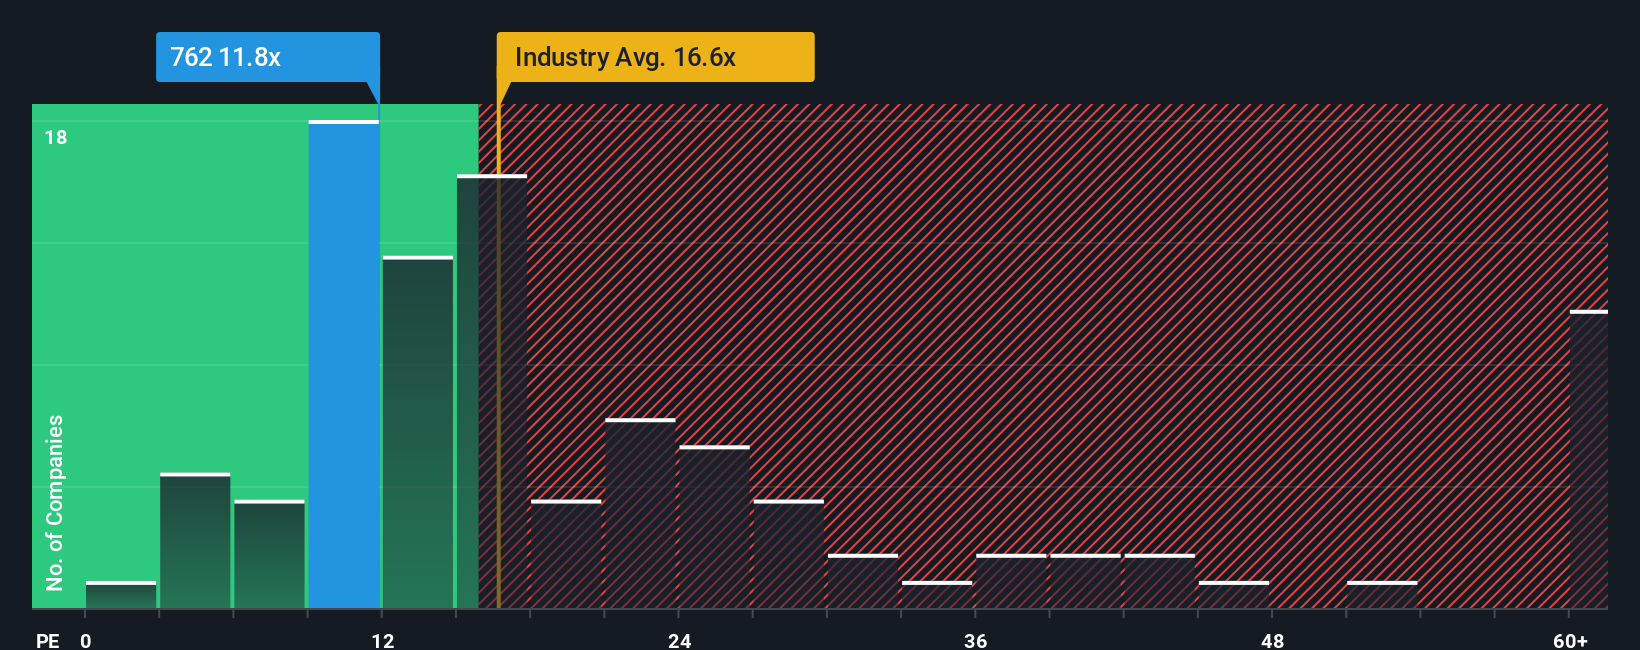
China Unicom currently trades on a PE of about 11.0x. That sits well below the broader Telecom industry average of around 16.2x and the peer group average of roughly 23.7x, which at first glance suggests the market is applying a clear discount. However, Simply Wall St also calculates a proprietary Fair Ratio of 14.7x for China Unicom. This is the PE you might expect given its specific mix of earnings growth, profit margins, industry dynamics, market cap and risk profile. This tailored benchmark is more informative than a simple comparison with generic industry or peer averages, because it directly reflects the company’s own fundamentals.
Comparing the Fair Ratio of 14.7x with the actual PE of 11.0x points to China Unicom still trading at a meaningful discount to what its earnings profile would typically warrant.
Result: UNDERVALUED
PE ratios tell one story, but what if the real opportunity lies elsewhere? Discover 1448 companies where insiders are betting big on explosive growth.
Upgrade Your Decision Making: Choose your China Unicom (Hong Kong) Narrative
Earlier we mentioned that there is an even better way to understand valuation, so let us introduce you to Narratives, a simple way to connect your view of China Unicom (Hong Kong) with the numbers by telling a clear story about its future revenue, earnings, margins and fair value, then comparing that to today’s price to decide whether to buy, hold or sell. On Simply Wall St’s Community page, millions of investors use Narratives as an accessible tool that links what they believe about a company, for example stronger growth from cloud and IoT, or slower progress due to government constraints and weak innovation, to a financial forecast and then to a fair value that automatically updates as new news, results or guidance come in. For China Unicom, one investor might build a bullish Narrative around rising connectivity subscribers, growing digital services and a fair value closer to HK$15.56, while another, more cautious, Narrative might focus on underinvestment, policy risk and slower domestic demand, leading to a fair value near HK$9.21.
Do you think there's more to the story for China Unicom (Hong Kong)? Head over to our Community to see what others are saying!
This article by Simply Wall St is general in nature. We provide commentary based on historical data and analyst forecasts only using an unbiased methodology and our articles are not intended to be financial advice. It does not constitute a recommendation to buy or sell any stock, and does not take account of your objectives, or your financial situation. We aim to bring you long-term focused analysis driven by fundamental data. Note that our analysis may not factor in the latest price-sensitive company announcements or qualitative material. Simply Wall St has no position in any stocks mentioned.
Have feedback on this article? Concerned about the content? Get in touch with us directly. Alternatively, email editorial-team@simplywallst.com