
Does The Recent Slide In Novo Nordisk Signal A Long Term Opportunity For Investors?
- Wondering if Novo Nordisk is a bargain or a bubble at today’s price? You are not alone, and this breakdown will clarify what you are really paying for.
- After a volatile stretch, the stock is up 4.8% over the last week but roughly flat over 30 days, while still sitting deep in the red year to date at -42.7% and down -52.1% over the past year, despite a 44.5% gain over five years.
- Those sharp swings have come as investors reassess the long term outlook for its blockbuster diabetes and obesity portfolio and weigh shifting expectations around competition and healthcare policy. At the same time, renewed focus on Novo Nordisk's pipeline, strategic partnerships, and regulatory developments has kept the stock firmly in the spotlight.
- On our checklist based valuation framework, Novo Nordisk scores a strong 5/6. This signals it screens as undervalued on most metrics. Next, we will unpack those methods one by one, before exploring an even more powerful way to think about what the market is truly pricing in.
Find out why Novo Nordisk's -52.1% return over the last year is lagging behind its peers.
Approach 1: Novo Nordisk Discounted Cash Flow (DCF) Analysis
A Discounted Cash Flow model estimates what a company is worth by projecting the cash it can generate in the future and then discounting those cash flows back to today in order to reflect risk and the time value of money.
For Novo Nordisk, the latest twelve month free cash flow is about DKK 67.6 billion. Analysts expect this to rise steadily, with projections and extrapolations pointing to free cash flow of roughly DKK 207.0 billion in 10 years. Simply Wall St uses a two stage Free Cash Flow to Equity approach, combining analyst forecasts for the next several years with longer term growth assumptions to build this path of rising cash flows.
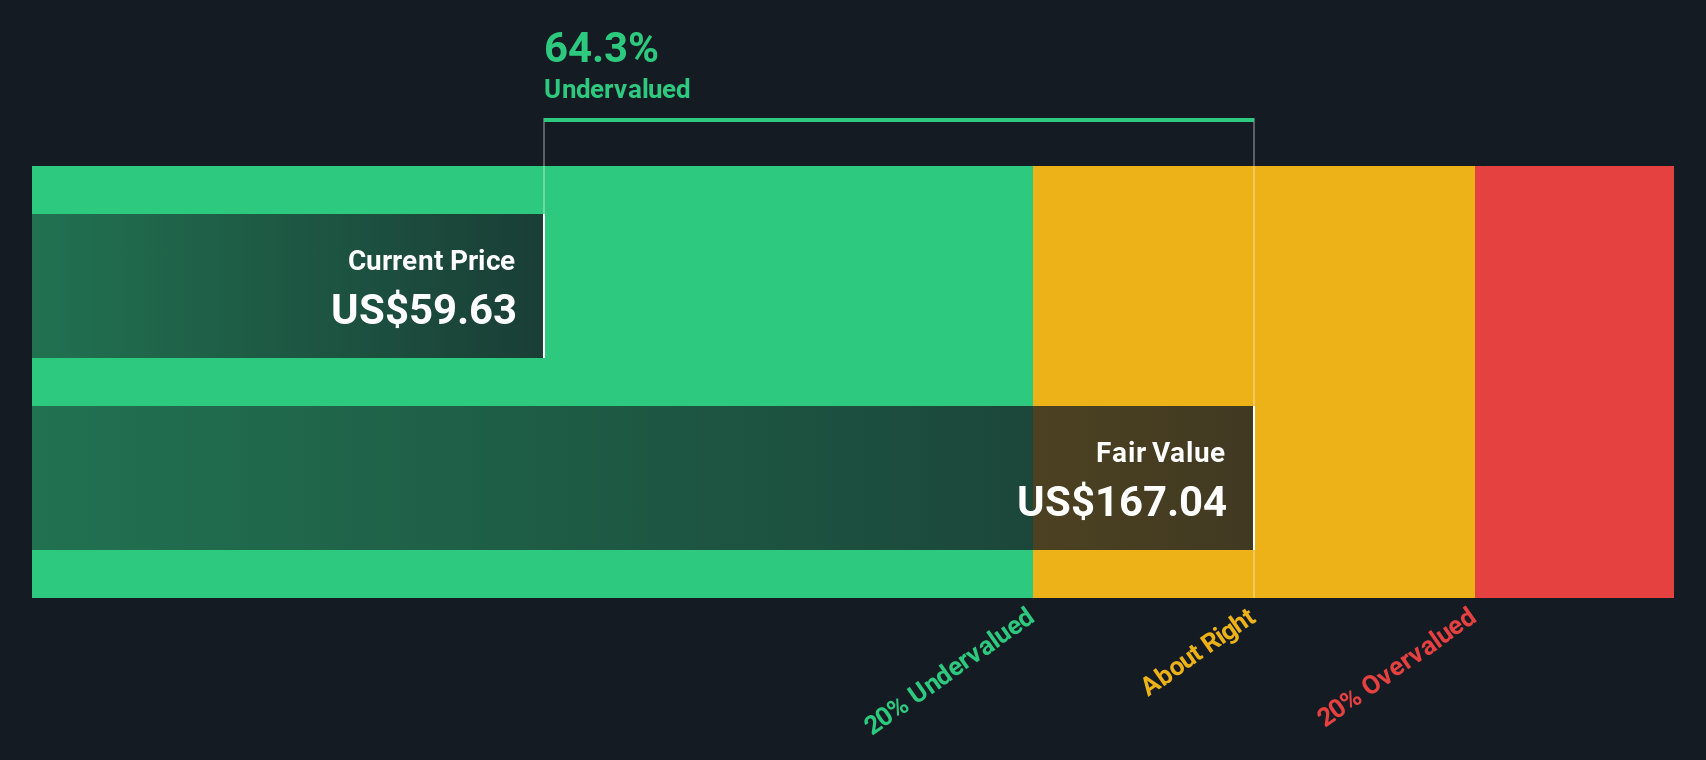
When all of those future DKK cash flows are discounted back to today, the model arrives at an estimated intrinsic value of $151.71 per share. Compared with the current market price, this implies Novo Nordisk is trading at a 66.9% discount to its DCF value, which suggests the market may be significantly underestimating the company’s long term cash generation potential.
Result: UNDERVALUED
Our Discounted Cash Flow (DCF) analysis suggests Novo Nordisk is undervalued by 66.9%. Track this in your watchlist or portfolio, or discover 907 more undervalued stocks based on cash flows.
Approach 2: Novo Nordisk Price vs Earnings
For a profitable business like Novo Nordisk, the price to earnings ratio is a useful shorthand for how much investors are willing to pay today for each dollar of current earnings. In general, companies with stronger and more reliable growth, higher margins, and lower perceived risk can justify a higher, or more expensive, PE multiple, while slower growing or riskier firms usually deserve a lower one.
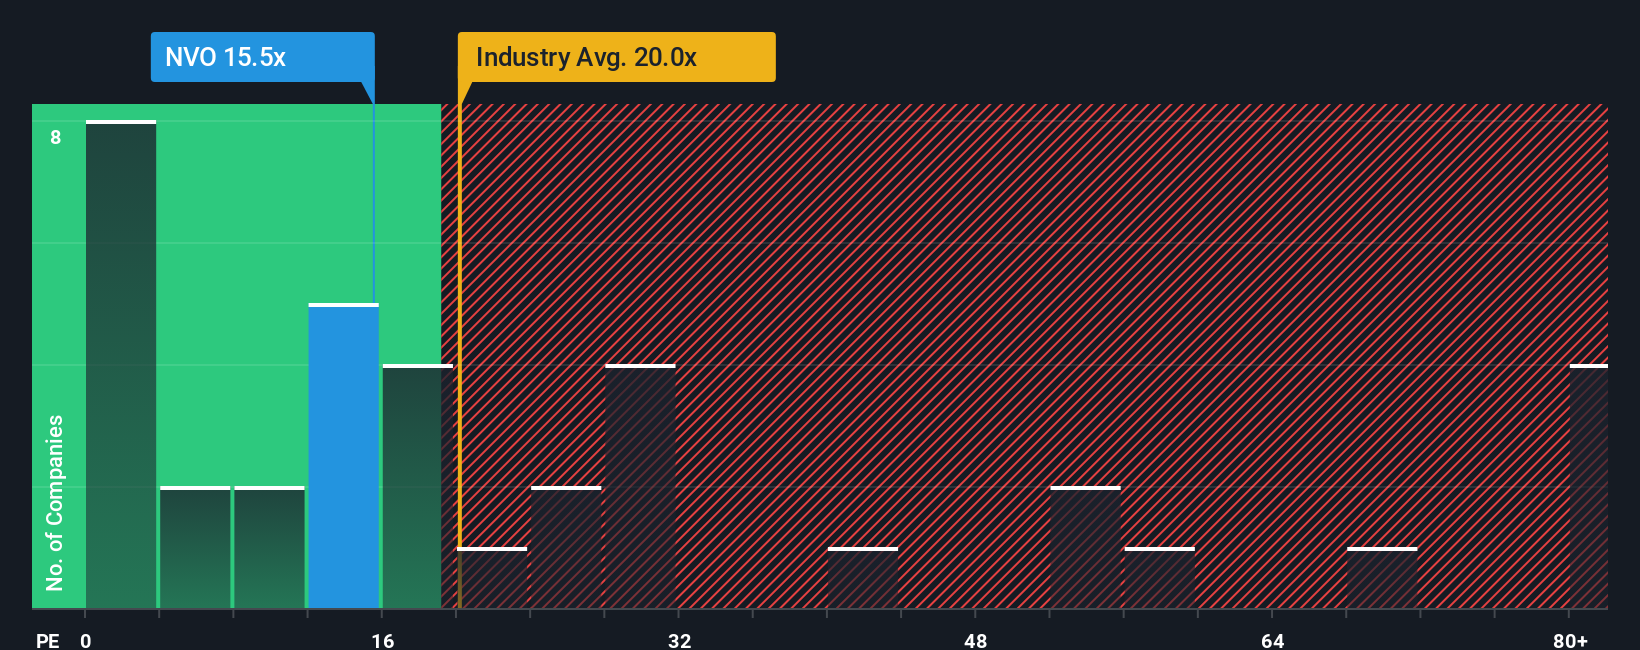
Right now, Novo Nordisk trades on a PE of about 13.8x, which is meaningfully below the Pharmaceuticals industry average of around 20.0x and also below the broader peer group average of roughly 16.5x. Simply Wall St goes a step further with its Fair Ratio, an estimate of what PE the company should trade on given its specific earnings growth outlook, profitability, industry, market cap, and risk profile. For Novo Nordisk, that Fair Ratio is materially higher at about 31.3x, suggesting that simple peer or sector comparisons may be understating its fundamentals.
When we set that Fair Ratio of 31.3x against the current 13.8x, the gap indicates the market is pricing Novo Nordisk at a meaningful discount to what its earnings profile appears to warrant.
Result: UNDERVALUED
PE ratios tell one story, but what if the real opportunity lies elsewhere? Discover 1448 companies where insiders are betting big on explosive growth.
Upgrade Your Decision Making: Choose your Novo Nordisk Narrative
Earlier we mentioned that there is an even better way to understand valuation, so let us introduce you to Narratives, a simple way to connect your view of a company’s story with the numbers behind its future.
A Narrative is your personal, evidence based storyline for a business, where you spell out how you think revenue, earnings, and margins will evolve and what that implies for fair value, instead of relying only on static multiples or one off models.
On Simply Wall St, Narratives live inside the Community page, where millions of investors can quickly link a company’s story to a full financial forecast and see the fair value that drops out of those assumptions, all in an accessible and guided format.
From there, Narratives help you decide how to respond by comparing that Fair Value to today’s Price, and they update dynamically as new information like earnings releases, guidance changes, or major news hits the market.
For example, one Novo Nordisk Narrative on the platform might see fair value near $70 per ADR while another pins it closer to $160, reflecting very different views on GLP 1 competition, policy risk, and pipeline success, and giving you a clear framework to decide which story you find more persuasive and how that influences your decisions.
Do you think there's more to the story for Novo Nordisk? Head over to our Community to see what others are saying!

This article by Simply Wall St is general in nature. We provide commentary based on historical data and analyst forecasts only using an unbiased methodology and our articles are not intended to be financial advice. It does not constitute a recommendation to buy or sell any stock, and does not take account of your objectives, or your financial situation. We aim to bring you long-term focused analysis driven by fundamental data. Note that our analysis may not factor in the latest price-sensitive company announcements or qualitative material. Simply Wall St has no position in any stocks mentioned.
Have feedback on this article? Concerned about the content? Get in touch with us directly. Alternatively, email editorial-team@simplywallst.com