
Tilray Brands Soars 65.3% Can the Rally Be Justified by Its Fundamentals in 2025
- If you are wondering whether Tilray Brands is finally a smart buy or just another volatile cannabis story, you are not alone. That is exactly what we are going to unpack here.
- The stock has surged about 65.3% over the past week, even though it is still down year to date and has had a rough 3 year stretch. This shows that sentiment can flip quickly when this name gets attention.
- Recently, Tilray has been in the spotlight as investors react to shifting expectations around US cannabis policy and the potential long term impact on cross border operators. In addition, the company has been leaning more into its diversified consumer product strategy, including beverages, which many see as a way to smooth out some of the sector specific risk.
- Right now Tilray scores a 3/6 valuation check score, suggesting it looks undervalued on some metrics but not convincingly cheap across the board. We will walk through those valuation methods next and then finish with a more intuitive way to think about what the stock might really be worth.
Find out why Tilray Brands's 2.1% return over the last year is lagging behind its peers.
Approach 1: Tilray Brands Discounted Cash Flow (DCF) Analysis
A Discounted Cash Flow model estimates what a business is worth today by projecting the cash it could generate in the future and then discounting those cash flows back to the present.
For Tilray Brands, the latest twelve month Free Cash Flow is about $93 million outflow, so the model assumes a turnaround from negative to positive cash generation. Analyst and extrapolated forecasts see Free Cash Flow rising to roughly $61 million by 2035, with interim milestones such as $15 million in 2026 and $43 million by 2030 as the business scales and margins improve.
Using a 2 Stage Free Cash Flow to Equity model based on these projections, Simply Wall St estimates an intrinsic value of about $10.97 per share. That outcome implies the stock is roughly 10.8% above its calculated fair value, meaning the market is already pricing in a good portion of the expected recovery and growth.
Result: OVERVALUED
Our Discounted Cash Flow (DCF) analysis suggests Tilray Brands may be overvalued by 10.8%. Discover 907 undervalued stocks or create your own screener to find better value opportunities.
Approach 2: Tilray Brands Price vs Sales
For companies like Tilray Brands that are still working toward consistent profitability, the Price to Sales ratio is often a more useful yardstick than earnings based metrics. Revenue tends to be more stable than earnings during turnaround phases, so it can give a cleaner read on how the market values each dollar of sales.
What investors are willing to pay for those sales depends on how fast they think revenue can grow and how risky that growth is. Higher growth and lower perceived risk usually justify a higher multiple, while slower or more uncertain growth should trade on a lower multiple.
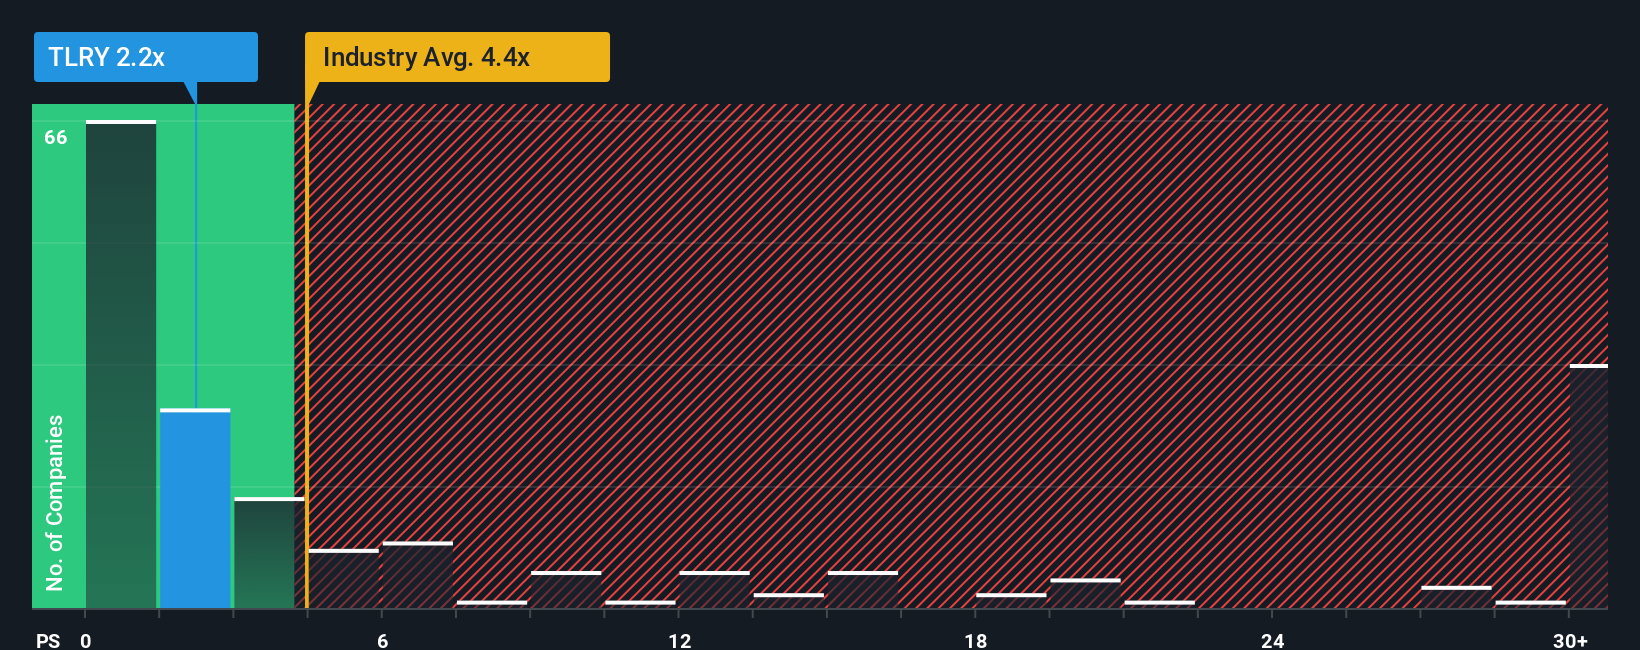
Tilray currently trades at about 1.69x sales, which is below the broader Pharmaceuticals industry average of roughly 4.07x and far under the peer group average of around 15.74x. Simply Wall St’s proprietary Fair Ratio model, which estimates what a stock’s multiple should be after accounting for its growth outlook, risks, profit margins, industry, and size, puts Tilray’s fair Price to Sales multiple closer to 2.20x. This company specific Fair Ratio is more informative than a simple peer or industry comparison because it adjusts for Tilray’s particular profile.
Comparing the current 1.69x to the 2.20x Fair Ratio suggests the market is pricing Tilray at a discount.
Result: UNDERVALUED
PS ratios tell one story, but what if the real opportunity lies elsewhere? Discover 1448 companies where insiders are betting big on explosive growth.
Upgrade Your Decision Making: Choose your Tilray Brands Narrative
Earlier we mentioned that there is an even better way to understand valuation, so let us introduce you to Narratives, a simple way to connect your view of Tilray Brands story with the numbers behind its future revenue, earnings, margins, and ultimately its fair value.
A Narrative on Simply Wall St is your own storyline for a company, where you spell out what you think will drive the business, translate that into a financial forecast, and see what fair value that implies so you can compare it directly to today’s share price and decide whether it looks like a buy, hold, or sell.
Available in the Community page used by millions of investors, Narratives are easy to set up, automatically refresh when new news or earnings arrive, and help you track how your thesis evolves over time without needing to rebuild complex models yourself.
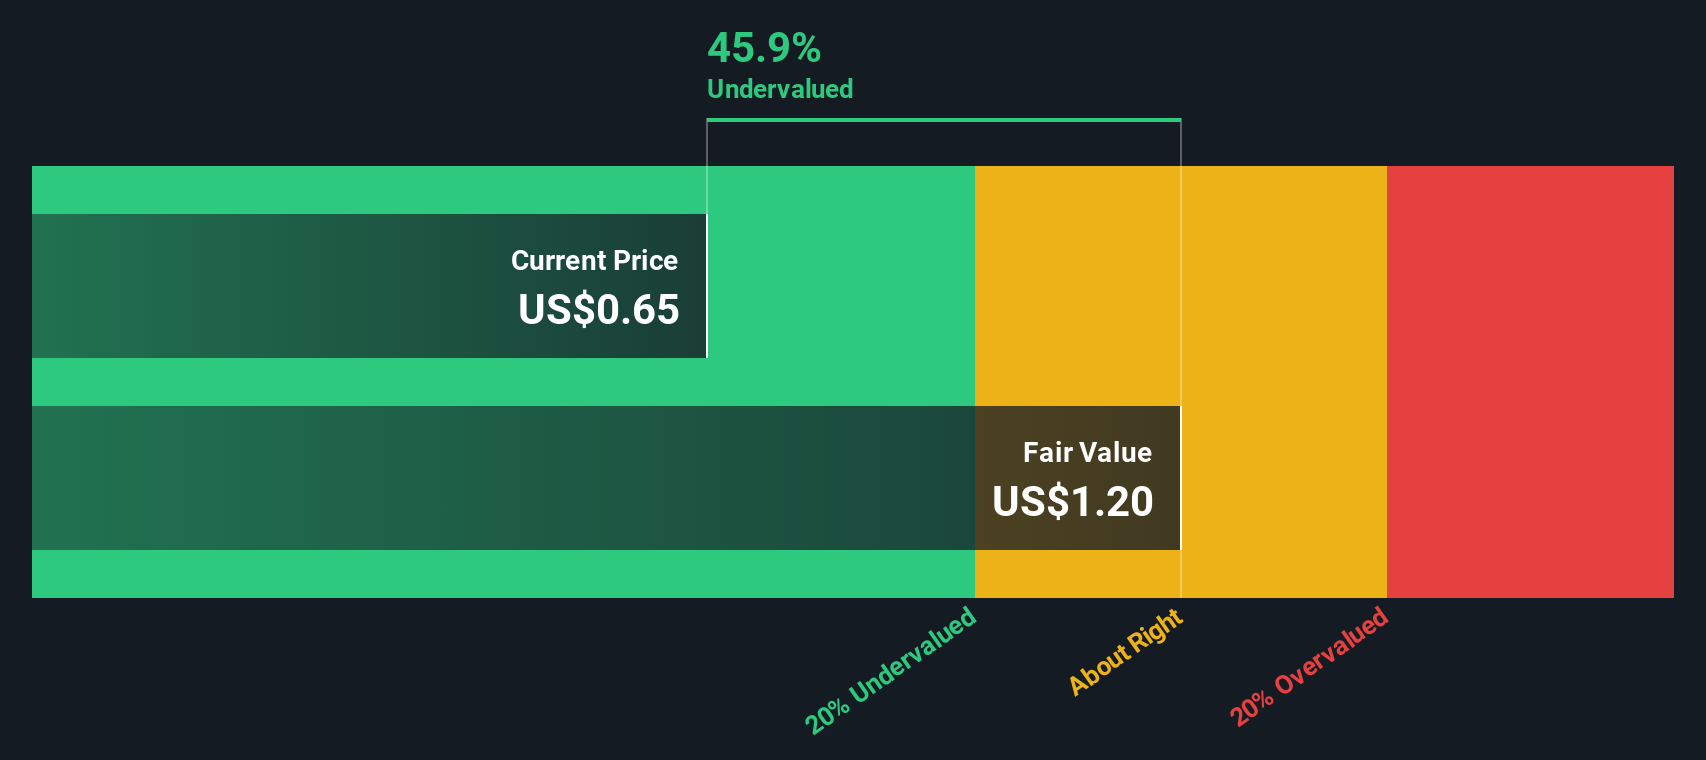
For Tilray Brands, for example, one optimistic Narrative might use the recent analyst fair value of about $16.17 per share based on steady global expansion and margin recovery. In contrast, a more cautious Narrative might lean toward the lower end of past analyst targets around $0.60 if you think regulatory, profitability, and dilution risks will continue to weigh on the business.
Do you think there's more to the story for Tilray Brands? Head over to our Community to see what others are saying!

This article by Simply Wall St is general in nature. We provide commentary based on historical data and analyst forecasts only using an unbiased methodology and our articles are not intended to be financial advice. It does not constitute a recommendation to buy or sell any stock, and does not take account of your objectives, or your financial situation. We aim to bring you long-term focused analysis driven by fundamental data. Note that our analysis may not factor in the latest price-sensitive company announcements or qualitative material. Simply Wall St has no position in any stocks mentioned.
Have feedback on this article? Concerned about the content? Get in touch with us directly. Alternatively, email editorial-team@simplywallst.com