
Is It Too Late to Consider Realty Income After Recent Portfolio Expansion?
- If you are wondering whether Realty Income is still attractively priced at around $57.72, or if the easy money has already been made, this article will walk through how the current price stacks up against its fundamentals.
- The stock has dipped about 1.3% over the last week but is still up 1.4% over 30 days, 9.7% year to date, and 10.4% over the past year. This quietly hints that the market may be rethinking both its growth prospects and risk profile.
- Recently, investors have been focused on Realty Income's continued portfolio expansion and its push into new property types and geographies. These moves can reshape both its growth runway and risk mix. There has also been ongoing attention on how expectations for higher interest rates affect REITs broadly, putting extra scrutiny on Realty Income's cost of capital and acquisition strategy.
- Right now, Realty Income scores just 2/6 on our valuation checks, suggesting that while some metrics flag it as undervalued, others are less convincing. Next, we will unpack those different valuation approaches before finishing with a more holistic way to think about what the stock might be worth.
Realty Income scores just 2/6 on our valuation checks. See what other red flags we found in the full valuation breakdown.
Approach 1: Realty Income Discounted Cash Flow (DCF) Analysis
A Discounted Cash Flow model projects Realty Income's future adjusted funds from operations, then discounts those cash flows back to today to estimate what the business is worth in $.
Realty Income generated about $3.6 billion in free cash flow over the last twelve months, and analysts expect this to climb steadily as the portfolio expands. By 2029, free cash flow is projected to reach roughly $4.7 billion, with further growth to about $5.8 billion by 2035 based on Simply Wall St extrapolations beyond the formal analyst window.
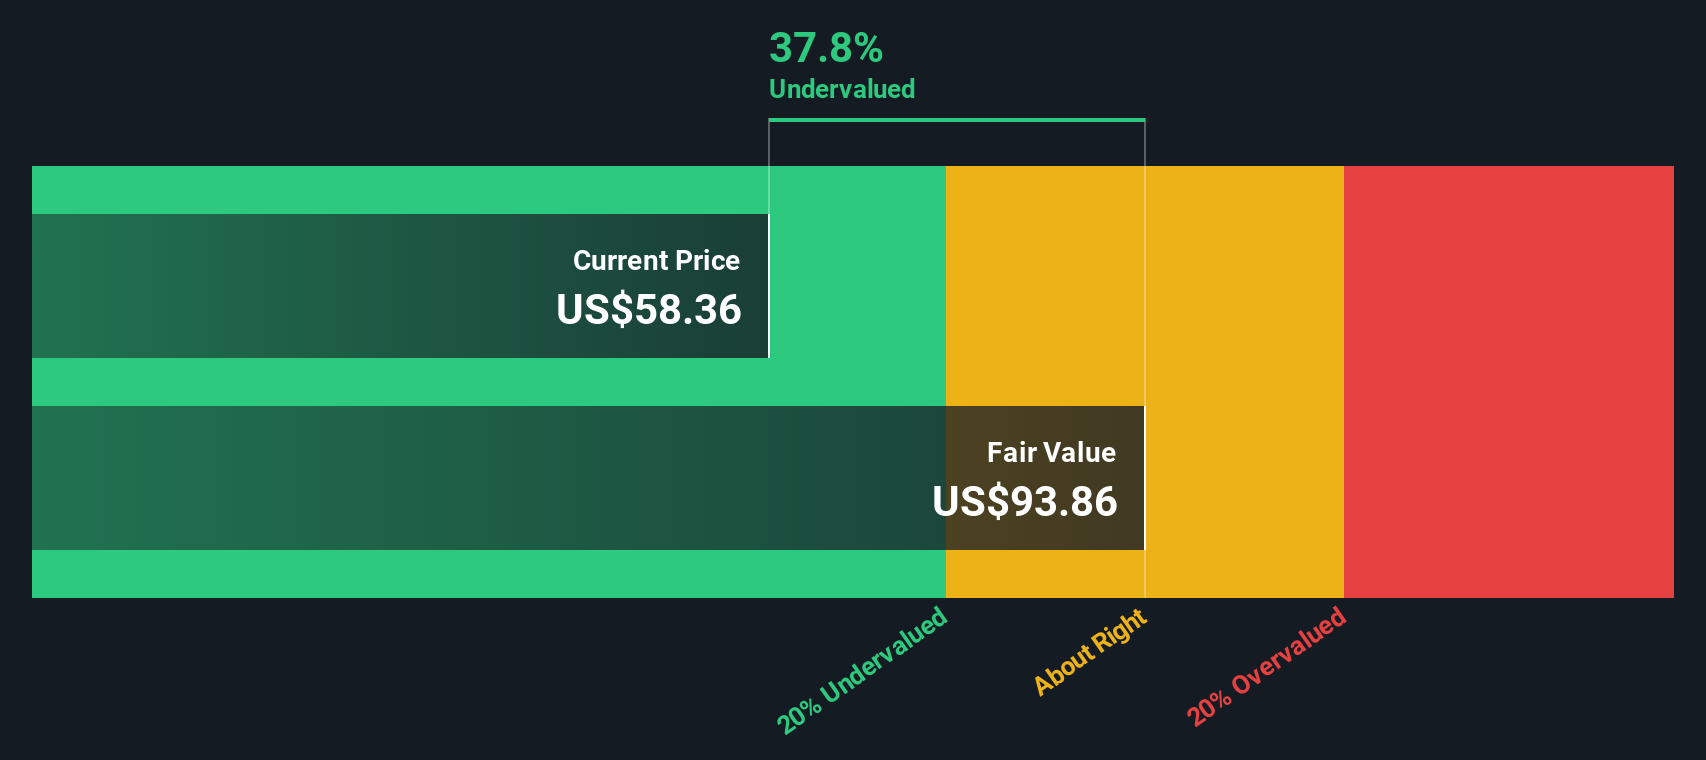
When these future cash flows are discounted back to today using a required return that reflects Realty Income's risk profile, the model arrives at an intrinsic value of about $97.54 per share. Versus a share price around $57.72, the DCF implies the stock is trading at roughly a 40.8% discount, and this suggests potential upside if these cash flow assumptions play out.
Result: UNDERVALUED
Our Discounted Cash Flow (DCF) analysis suggests Realty Income is undervalued by 40.8%. Track this in your watchlist or portfolio, or discover 907 more undervalued stocks based on cash flows.
Approach 2: Realty Income Price vs Earnings
The price to earnings ratio is a useful yardstick for profitable companies because it connects what investors pay today with the earnings the business is generating right now. In broad terms, stronger and more reliable growth usually justifies a higher PE, while elevated risk or more cyclical earnings tend to cap what investors are willing to pay as a multiple.
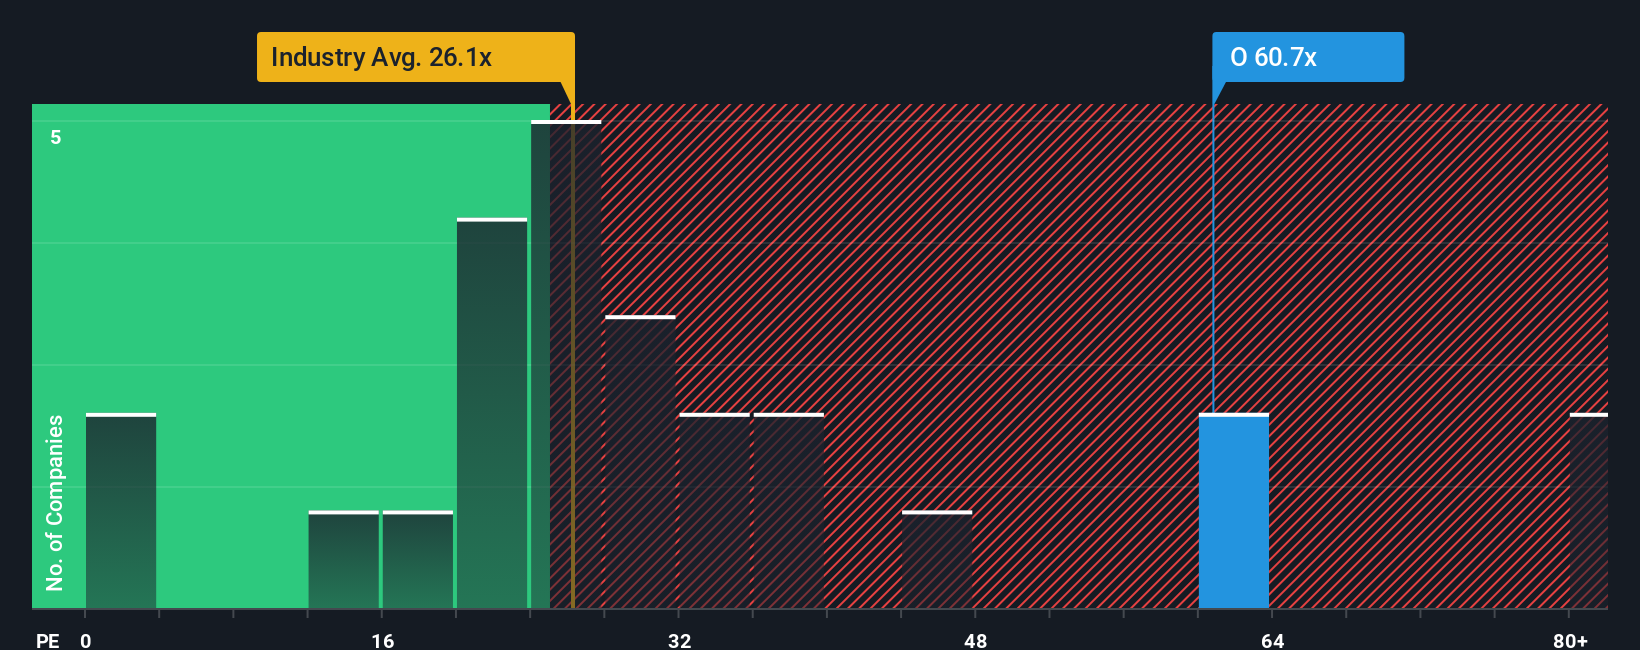
Realty Income currently trades on a PE of about 55.19x, which is well above the Retail REITs industry average of around 27.16x and also higher than the broader peer group average of roughly 31.55x. On the surface, that suggests investors are already paying a premium for Realty Income's stability and growth profile.
Simply Wall St's Fair Ratio framework goes a step further by estimating what PE the stock should trade at given its specific mix of earnings growth, profit margins, size, industry positioning and risk factors. For Realty Income, this Fair Ratio is 34.56x, notably below the current 55.19x. Because this approach adjusts for the company’s own fundamentals rather than relying only on broad peer or sector comparisons, it can provide a more tailored view of value. Against this lens, Realty Income screens as meaningfully overvalued on a PE basis.
Result: OVERVALUED
PE ratios tell one story, but what if the real opportunity lies elsewhere? Discover 1448 companies where insiders are betting big on explosive growth.
Upgrade Your Decision Making: Choose your Realty Income Narrative
Earlier we mentioned that there is an even better way to understand valuation, so let us introduce you to Narratives, a simple way to connect your view of Realty Income’s story with a structured financial forecast and a fair value estimate. A Narrative lets you spell out why you think the business will grow the way it will, then links that story to assumptions for future revenue, earnings and margins, and ultimately to the fair value you think the shares are worth. On Simply Wall St’s Community page, millions of investors can build and browse these Narratives, then compare each Narrative’s Fair Value to the current share price to decide how they view Realty Income at the moment. Because Narratives update dynamically as new information comes in, your view can evolve automatically when earnings, news or guidance changes. For example, one Realty Income Narrative might see fair value near $61, based on slower dividend growth and a hold stance, while a more optimistic Narrative might see value in the low to mid 60 dollar range with stronger long term earnings assumptions, and both perspectives remain transparent and easy to compare.
Do you think there's more to the story for Realty Income? Head over to our Community to see what others are saying!

This article by Simply Wall St is general in nature. We provide commentary based on historical data and analyst forecasts only using an unbiased methodology and our articles are not intended to be financial advice. It does not constitute a recommendation to buy or sell any stock, and does not take account of your objectives, or your financial situation. We aim to bring you long-term focused analysis driven by fundamental data. Note that our analysis may not factor in the latest price-sensitive company announcements or qualitative material. Simply Wall St has no position in any stocks mentioned.
Have feedback on this article? Concerned about the content? Get in touch with us directly. Alternatively, email editorial-team@simplywallst.com