
Has Schneider Electric’s Strong Multi Year Run Left Much Upside for 2025?
- If you are wondering whether Schneider Electric is still a smart buy at today’s price, or if most of the upside has already been captured, you are not alone. This article will walk through what the current market is really pricing in.
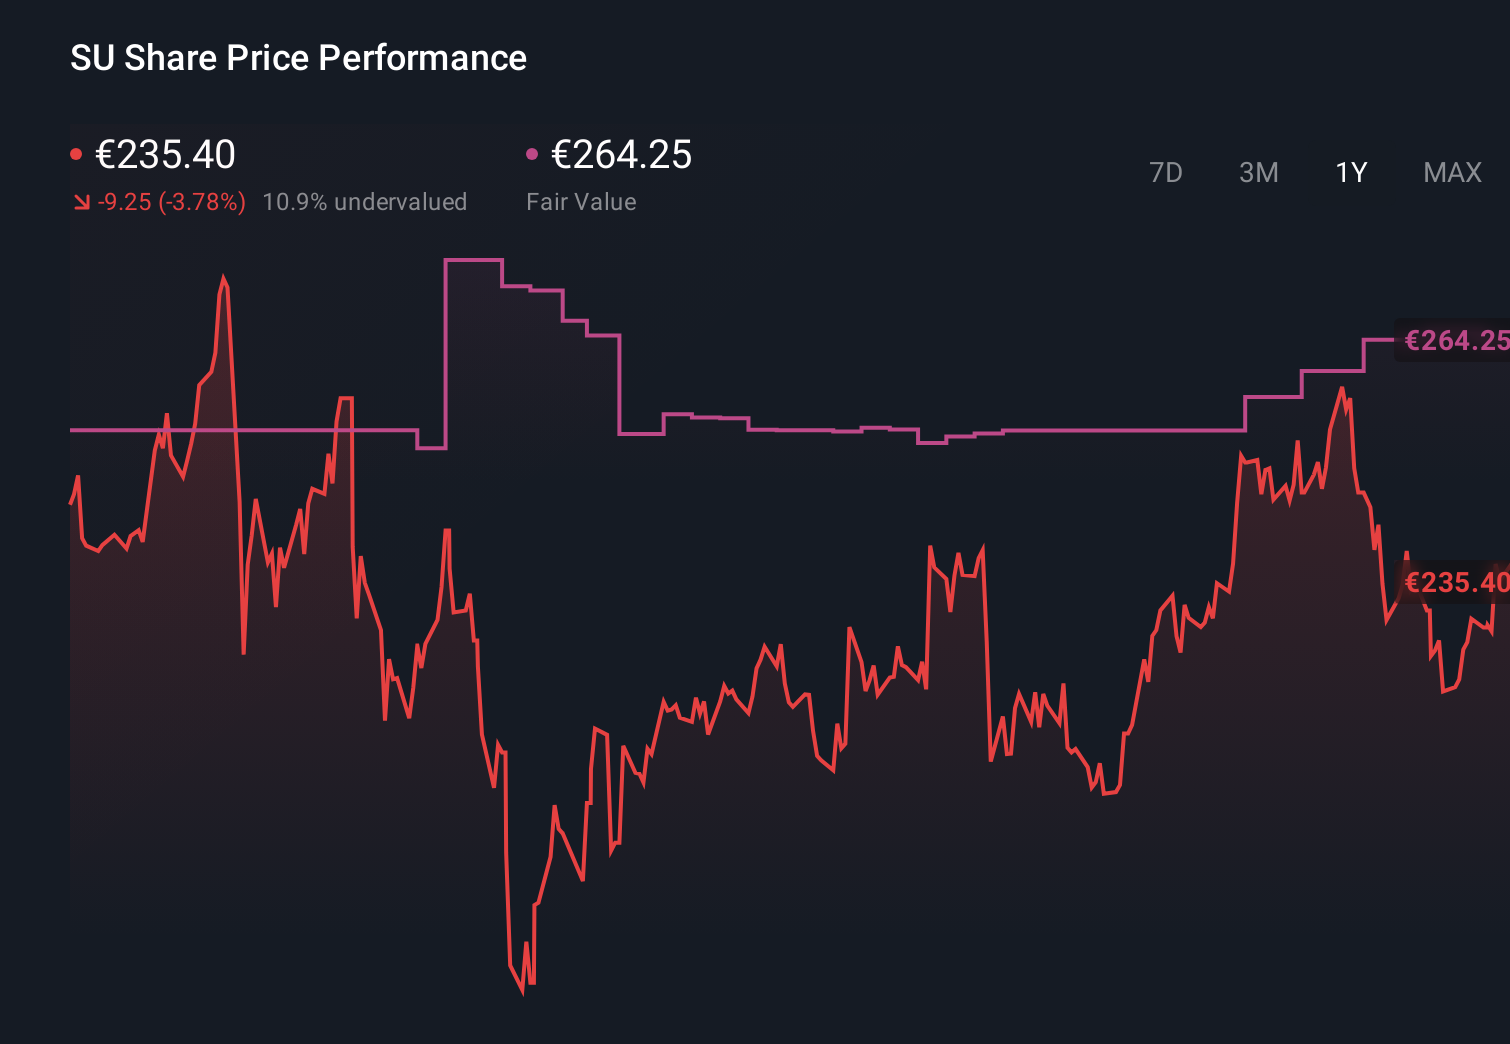
- Despite a strong multi year run, with the stock up roughly 121% over five years and almost 90% over three, the more recent picture has flattened out, with the share price roughly flat over 7 days and slightly negative over the last month and year to date.
- Recent share price hesitation comes as Schneider Electric continues to position itself as a key player in energy management and industrial automation, areas that are central to global electrification and digitalization trends. Strategic moves around grid modernisation, data centers and sustainability solutions have kept investors focused on its long term growth runway even while the stock has paused.
- According to our valuation checks, Schneider Electric currently scores just 1 out of 6 for being undervalued. This suggests the market may already be pricing in a lot of good news, but as we dig into different valuation approaches later and finish with a more holistic way to think about fair value, the headline score may not tell the whole story.
Schneider Electric scores just 1/6 on our valuation checks. See what other red flags we found in the full valuation breakdown.
Approach 1: Schneider Electric Discounted Cash Flow (DCF) Analysis
A Discounted Cash Flow model estimates what a company is worth by projecting its future cash flows and then discounting them back to today using a required rate of return. It is essentially asking how much those future euros of cash are worth in today’s money.
For Schneider Electric, the model starts with last twelve month free cash flow of about €3.8 billion and applies a two stage Free Cash Flow to Equity approach. Analyst estimates drive the first few years, with free cash flow expected to rise to roughly €5.3 billion by 2026 and €6.1 billion by 2027, before transitioning to more modest, extrapolated growth. By 2035, free cash flow is projected at around €6.6 billion, with later years based on Simply Wall St’s gradual growth assumptions.
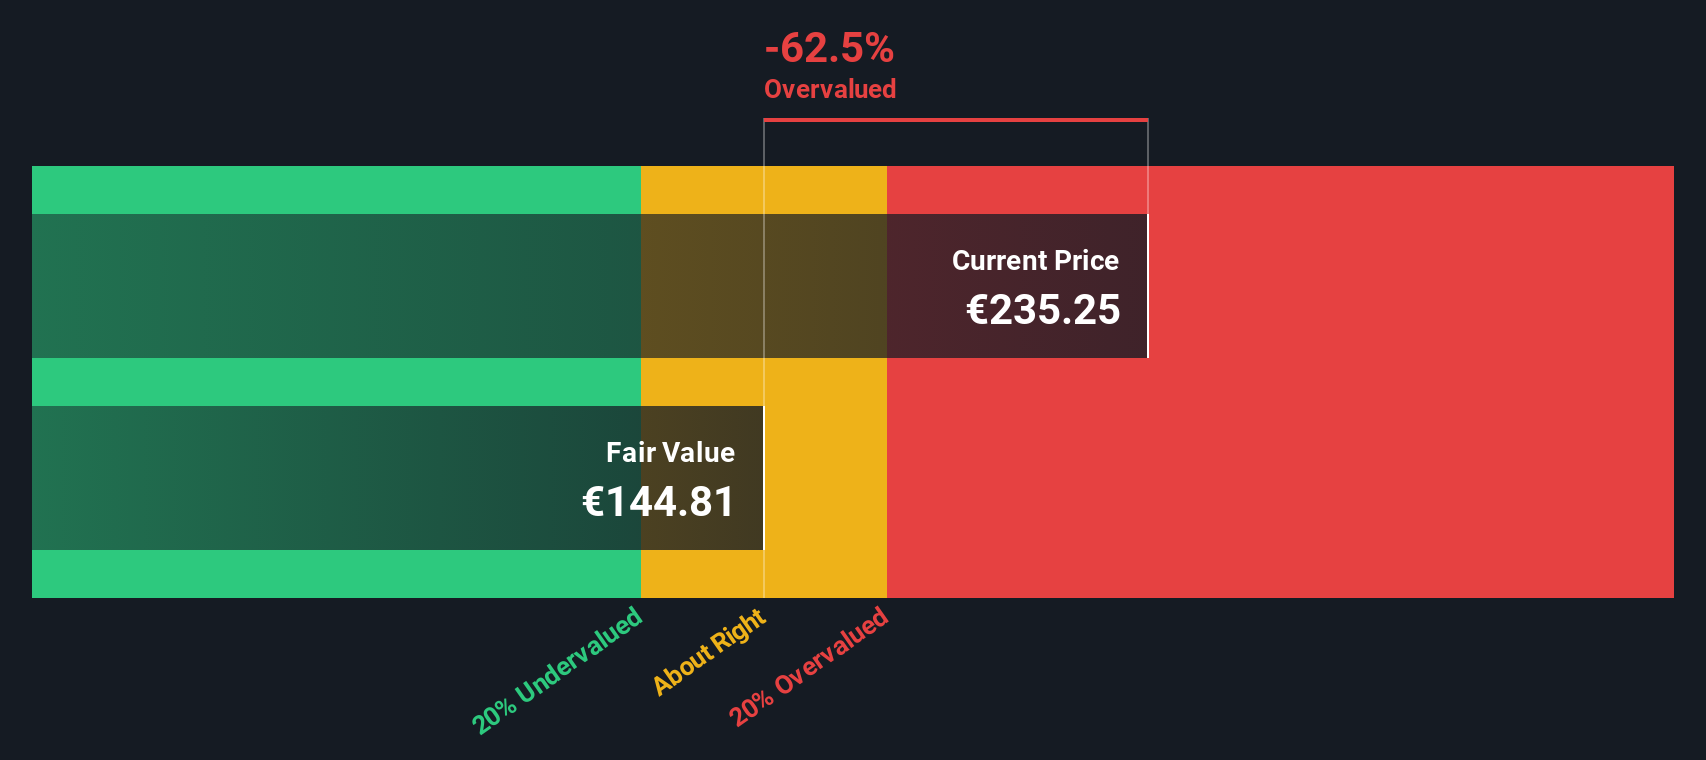
Discounting this stream of cash flows back to today yields an intrinsic value of about €141.93 per share. Compared with the current market price, the model implies the stock is about 65.9% overvalued, suggesting a substantial valuation premium baked into expectations.
Result: OVERVALUED
Our Discounted Cash Flow (DCF) analysis suggests Schneider Electric may be overvalued by 65.9%. Discover 907 undervalued stocks or create your own screener to find better value opportunities.
Approach 2: Schneider Electric Price vs Earnings
For a mature, consistently profitable business like Schneider Electric, the price to earnings, or PE, ratio is a useful shorthand for how many euros investors are willing to pay today for each euro of current earnings. It naturally links valuation to profitability, which is what ultimately supports shareholder returns over time.
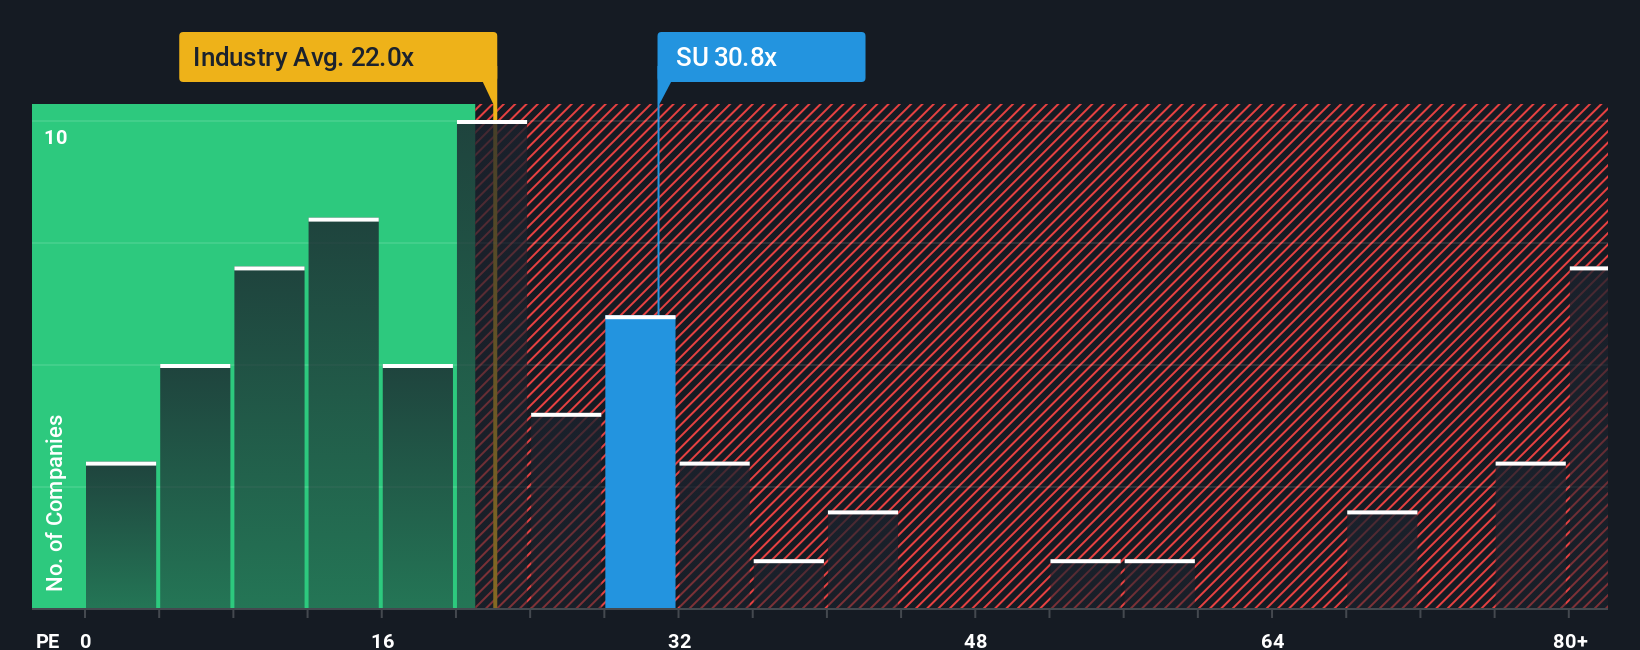
What counts as a “normal” PE depends on how fast earnings are expected to grow and how risky those earnings are. Faster growth, stronger competitive positions and lower perceived risk usually justify a higher PE, while cyclical or uncertain earnings deserve a lower one. Schneider Electric currently trades on about 30.80x earnings, which is a premium to the broader Electrical industry average of around 29.61x and to its peer group on roughly 23.99x. That suggests the market already views Schneider as a higher quality, higher growth name than many of its rivals.
Simply Wall St’s Fair Ratio for Schneider Electric comes in at about 33.58x. This proprietary metric estimates the PE the company should trade on after adjusting for its specific growth outlook, profitability profile, risk factors, industry context and market cap, rather than relying on blunt peer or sector averages. Because it integrates these fundamentals, the Fair Ratio offers a more tailored view of what “fair value” looks like for Schneider in particular.
Comparing the Fair Ratio of 33.58x with the current PE of 30.80x suggests the stock is trading below where it might reasonably sit on fundamentals, indicating some upside potential rather than excessive optimism at today’s price.
Result: UNDERVALUED
PE ratios tell one story, but what if the real opportunity lies elsewhere? Discover 1448 companies where insiders are betting big on explosive growth.
Upgrade Your Decision Making: Choose your Schneider Electric Narrative
Earlier we mentioned that there is an even better way to understand valuation, so let us introduce you to Narratives, a simple tool that lets you attach a clear story to the numbers you use for Schneider Electric’s future revenue, earnings, margins and fair value. A Narrative is your view of how the business will actually evolve, translated into a financial forecast and then into a fair value estimate, so you can directly compare your Fair Value to today’s Price and decide whether to buy, hold or sell. Narratives are available on Simply Wall St’s Community page, where millions of investors share and refine their views, and your Narrative automatically updates as fresh news, earnings and estimates come in. For example, one Schneider Electric Narrative might assume robust data center driven growth and justify a fair value near the high end of recent targets around €289, while a more cautious Narrative could emphasize margin pressures and assign a fair value closer to the low end near €220, showing how different stories reasonably lead to different prices.
Do you think there's more to the story for Schneider Electric? Head over to our Community to see what others are saying!
This article by Simply Wall St is general in nature. We provide commentary based on historical data and analyst forecasts only using an unbiased methodology and our articles are not intended to be financial advice. It does not constitute a recommendation to buy or sell any stock, and does not take account of your objectives, or your financial situation. We aim to bring you long-term focused analysis driven by fundamental data. Note that our analysis may not factor in the latest price-sensitive company announcements or qualitative material. Simply Wall St has no position in any stocks mentioned.
Have feedback on this article? Concerned about the content? Get in touch with us directly. Alternatively, email editorial-team@simplywallst.com