
JBM Healthcare (SEHK:2161) Net Margin Expansion Reinforces Bullish Growth Narrative in H1 2026
JBM (Healthcare) (SEHK:2161) has reported H1 2026 revenue of HK$429.6 million with basic EPS of HK$0.141, building on a twelve month track where earnings grew 32% and five year EPS growth averaged 53.2% per year. Over recent periods the company has seen revenue move from HK$720.5 million to HK$812.98 million on a trailing twelve month basis, while net income excluding extra items rose from HK$163.9 million to HK$216.4 million. This sets up this half year print against a backdrop of improving net profit margins and expanding EPS that investors will be keen to benchmark against future growth expectations.
See our full analysis for JBM (Healthcare).With the headline numbers on the table, the next step is to weigh them against the most widely held narratives about JBM, highlighting where the latest results support the story and where they start to push back on consensus views.
Curious how numbers become stories that shape markets? Explore Community Narratives
Net margin holds at 26.6%
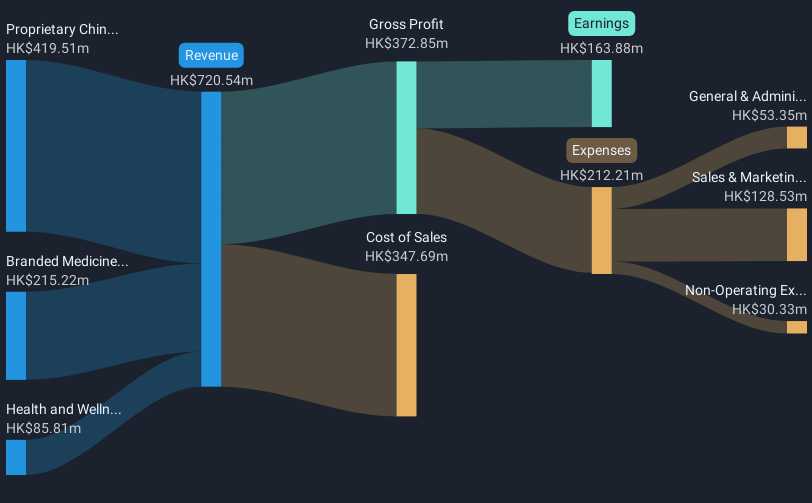
- Over the last 12 months JBM turned HK$812.98 million of revenue into HK$216.39 million of net income excluding extra items, which works out to a 26.6% net profit margin compared with 22.7% a year earlier.
- Bulls see this margin profile as evidence of a solid, branded healthcare franchise, and the latest numbers strengthen that view by showing:
- Net income excluding extra items on a trailing twelve month basis has risen from HK$163.88 million to HK$216.39 million, outpacing revenue growth from HK$720.54 million to HK$812.98 million.
- Over the same period, basic EPS on a trailing twelve month basis moved from HK$0.1948 to HK$0.2462, aligning with the bullish argument that JBM can convert top line growth into faster profit expansion.
H1 2026 builds on 32% earnings growth
- H1 2026 basic EPS of HK$0.141 compares with HK$0.116 in H1 2025 and HK$0.108 in H2 2025, fitting into a trailing twelve month picture where earnings grew 32% year on year and five year EPS growth has averaged 53.2% per year.
- Supporters with a bullish stance argue that this track record underpins the idea of durable growth, and the reported figures give them several concrete data points:
- Net income excluding extra items for H1 2026 was HK$115.01 million versus HK$95.88 million in H1 2025 and HK$101.38 million in H2 2025, illustrating how profit has increased across recent half year periods, not just in a single spike.
- Trailing twelve month basic EPS of HK$0.2462 sits above each individual half year print, which bullish investors interpret as evidence that the business is scaling over time rather than relying on one off gains.
Valuation caught between growth and cash payout
- JBM trades on a trailing P E of 10.1 times earnings against a Hong Kong pharmaceuticals industry average of 13.5 times, a peer average of 8.6 times, a DCF fair value of HK$2.36 and a share price of HK$2.67, while the trailing dividend yield is about 7.3% but is not well covered by free cash flow.
- More cautious, bearish leaning investors focus on this mix of numbers to question how much safety is really in the current price, and the reported data gives them several angles to press:
- The stock screens cheaper than the broader Hong Kong market and its pharmaceuticals industry on P E, yet richer than the immediate peer group at 8.6 times. Bears argue this limits multiple expansion if growth ever slows from the forecast 14.5% earnings rate.
- The 7.3% dividend yield, flagged as not well covered by free cash flow, sits beside a share price that is above DCF fair value of HK$2.36. Critics highlight this as a sign that both income and valuation support depend on the strong growth trends continuing.
Next Steps
Don't just look at this quarter; the real story is in the long-term trend. We've done an in-depth analysis on JBM (Healthcare)'s growth and its valuation to see if today's price is a bargain. Add the company to your watchlist or portfolio now so you don't miss the next big move.
Explore Alternatives
While JBM is growing earnings, its dividend looks stretched against free cash flow and the share price already trades above estimated fair value.
If that mix feels uncomfortably tight for your risk tolerance, use our these 903 undervalued stocks based on cash flows to quickly focus on companies where price, cash generation, and upside potential are better aligned.
This article by Simply Wall St is general in nature. We provide commentary based on historical data and analyst forecasts only using an unbiased methodology and our articles are not intended to be financial advice. It does not constitute a recommendation to buy or sell any stock, and does not take account of your objectives, or your financial situation. We aim to bring you long-term focused analysis driven by fundamental data. Note that our analysis may not factor in the latest price-sensitive company announcements or qualitative material. Simply Wall St has no position in any stocks mentioned.
Have feedback on this article? Concerned about the content? Get in touch with us directly. Alternatively, email editorial-team@simplywallst.com