
Butler National (BUKS) Q2 EPS Jump Reinforces Bullish Profitability Narratives
Butler National (BUKS) has put up another solid quarter, with Q2 2026 revenue of about $23.3 million and net income of $6.0 million translating to basic EPS of roughly $0.09. This is underpinned by a trailing net profit margin of 19% and earnings growth of 29.2% over the past 12 months. The company has seen revenue move from around $21.4 million and EPS of about $0.05 in Q2 2025 to $23.3 million and $0.09 in Q2 2026, against a backdrop of five year compound earnings growth of 31.6%. This sets up a clean, margin driven story for investors to dig into this quarter.
See our full analysis for Butler National.With the latest numbers on the table, the next step is to see how this earnings profile lines up with the most widely held narratives around Butler National and where the data might challenge or reinforce those views.
Curious how numbers become stories that shape markets? Explore Community Narratives
19 percent margin supports 31.6 percent growth track
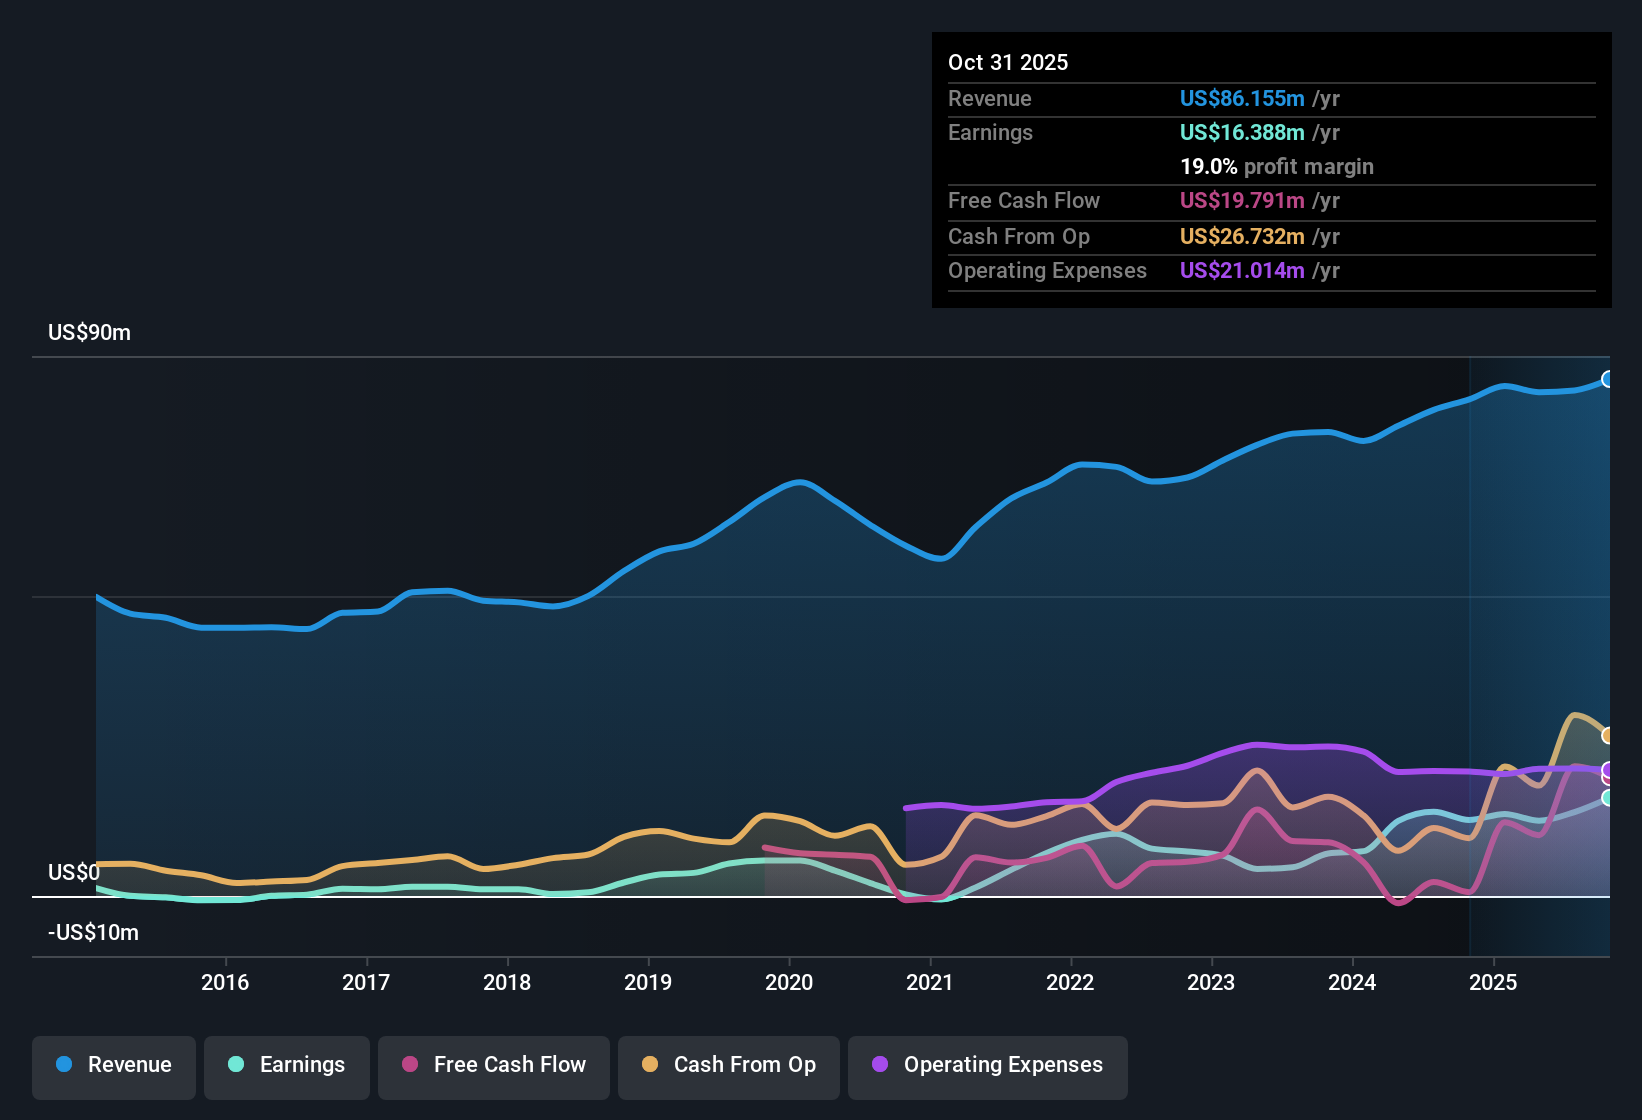
- Over the last 12 months Butler National generated $86.2 million in revenue and $16.4 million in net income, which works out to a 19 percent net margin alongside five year compound earnings growth of 31.6 percent per year.
- What stands out for a bullish view is that niche aerospace and defense work is often seen as capable of supporting higher margins. The combination of a 19 percent trailing margin with 31.6 percent annualized earnings growth over five years suggests the business has been able to convert that positioning into consistent profitability and scale.
- Supporters can point to the $16.4 million of trailing net income on $86.2 million of sales as evidence that the current profitability is not a one off, but is backed by a full year of operations.
- They can also note that trailing earnings grew 29.2 percent in the most recent year, close to the 31.6 percent five year pace, indicating that recent performance is broadly aligned with the longer term growth profile.
When a company combines multi year earnings compounding with a double digit net margin, investors naturally ask how durable that mix of profitability and growth might be in the segments it serves.
📊 Read the full Butler National Consensus Narrative.P E of 10.8x versus peers near 38x
- On valuation metrics Butler National trades at a trailing P E of 10.8 times, compared with roughly 37.8 times for the broader US Aerospace and Defense industry and about 37.3 times for peers, so the stock changes hands at less than one third of those reference multiples.
- From a bullish angle, this large discount is often framed as an opportunity. The current gap between a 10.8 times multiple and peer levels near the high 30s is easier to justify as potential upside when set against the company’s 29.2 percent trailing earnings growth and 19 percent margin.
- Backers of the bullish case may argue that the combination of a P E less than one third of peers and earnings compounding at 31.6 percent annually over five years looks like a misalignment between fundamentals and pricing.
- At the same time, the 29.2 percent trailing growth rate is slightly below the 31.6 percent five year average, which gives more cautious investors a concrete reason to question whether the valuation gap will close quickly or gradually.
DCF fair value far above 2.76 share price
- The provided DCF fair value of 14.50 dollars per share sits well above the current 2.76 dollar share price, implying a large difference between a cash flow based estimate and where the market is actually pricing Butler National today.
- For investors leaning bullish, this contrast between price and DCF fair value looks more convincing when paired with the hard numbers on profitability, because a 19 percent net margin and $16.4 million of trailing net income on $86.2 million of revenue give tangible support to the idea that the underlying cash generation could justify a higher valuation over time.
- Proponents can point out that the stock trades not only at a steep discount to the 14.50 dollar DCF fair value but also well below industry and peer P E levels despite that earnings base.
- More guarded investors, though, may focus on the fact that trailing year earnings growth of 29.2 percent is only modestly below the 31.6 percent five year trend, which keeps the story grounded in actual recent performance rather than assuming acceleration that is not visible in the current data.
Next Steps
Don't just look at this quarter; the real story is in the long-term trend. We've done an in-depth analysis on Butler National's growth and its valuation to see if today's price is a bargain. Add the company to your watchlist or portfolio now so you don't miss the next big move.
See What Else Is Out There
Despite healthy margins and a discounted P E, Butler National’s earnings growth is easing slightly and investors still face uncertainty over how quickly the valuation gap might close.
If you want businesses where pricing more clearly reflects quality and momentum right now, use our stable growth stocks screener (2103 results) to focus on companies delivering dependable earnings progress without relying on a rerating story.
This article by Simply Wall St is general in nature. We provide commentary based on historical data and analyst forecasts only using an unbiased methodology and our articles are not intended to be financial advice. It does not constitute a recommendation to buy or sell any stock, and does not take account of your objectives, or your financial situation. We aim to bring you long-term focused analysis driven by fundamental data. Note that our analysis may not factor in the latest price-sensitive company announcements or qualitative material. Simply Wall St has no position in any stocks mentioned.
Have feedback on this article? Concerned about the content? Get in touch with us directly. Alternatively, email editorial-team@simplywallst.com