
Has Whirlpool’s Share Slide Created a Value Opportunity in 2025?
- If you are wondering whether Whirlpool is quietly turning into a value opportunity after a brutal few years, you are not alone. This is exactly the kind of setup value focused investors often like to examine closely.
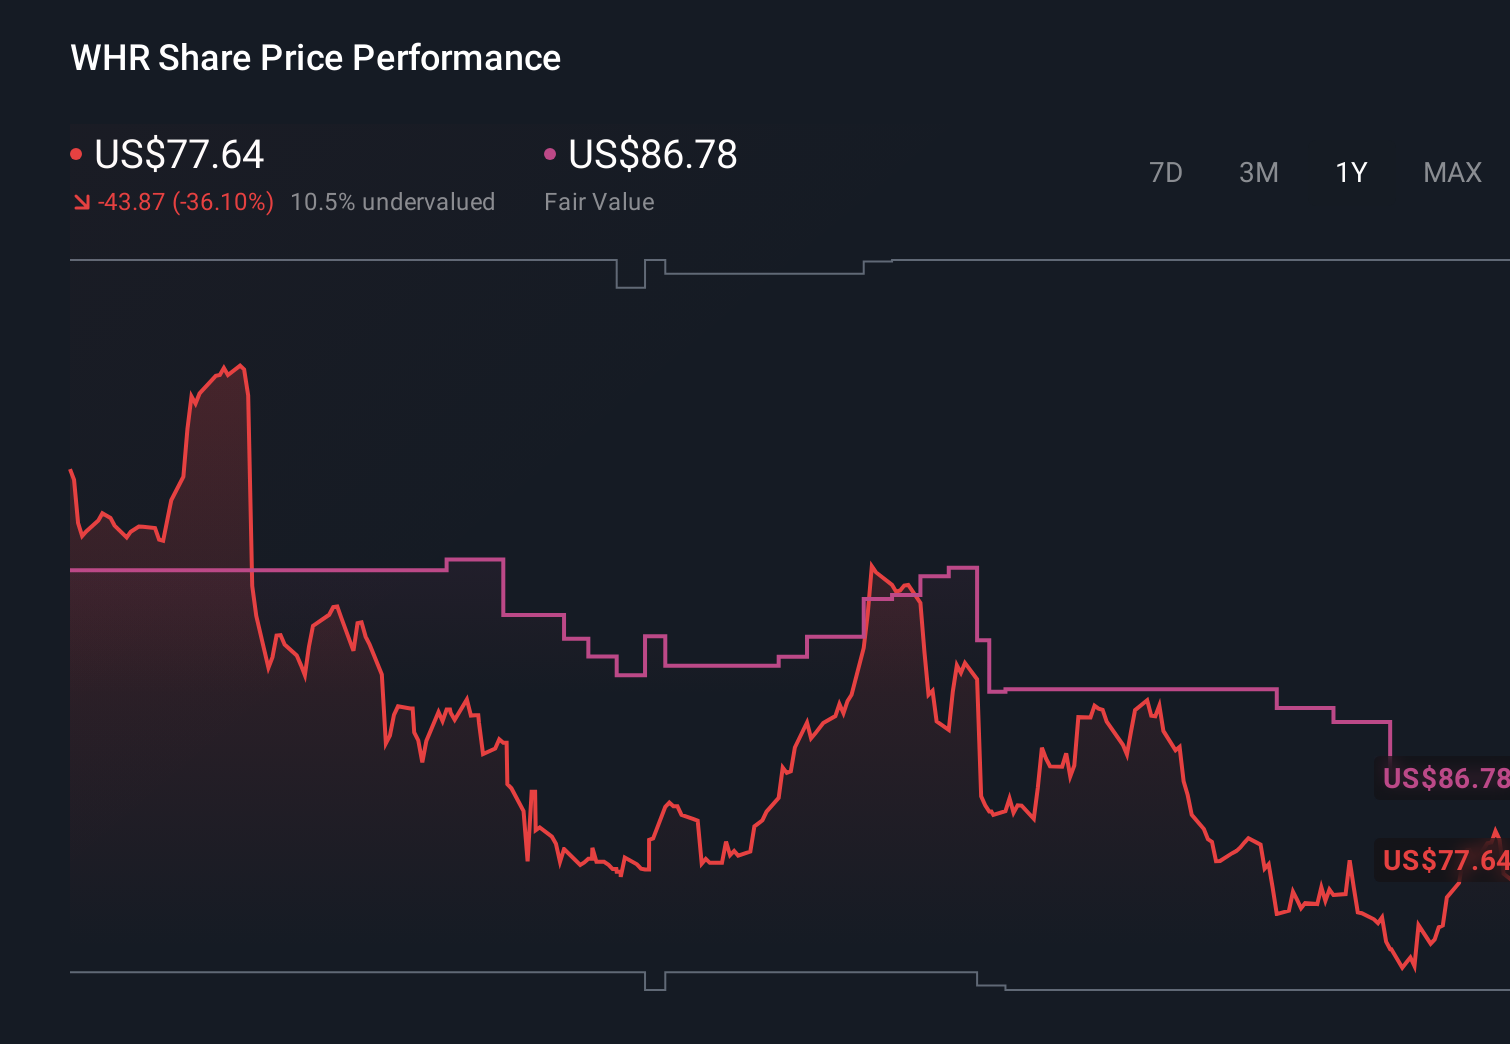
- After sliding heavily this year, Whirlpool has bounced 2.1% over the last week and 16.5% over the last month. It is still down roughly 32.5% year to date and about 32.8% over the past year, which suggests sentiment is still catching up to recent moves.
- Recent headlines have focused on Whirlpool reshaping its portfolio and tightening its focus on core home appliance markets, along with ongoing efforts to manage costs and streamline operations. This helps explain why some investors are rethinking the stock after its long slide. At the same time, the broader conversation around slowing housing and consumer spending remains a headwind, keeping expectations in check even as the company works to reposition itself.
- Right now, Whirlpool scores a 5/6 valuation check on our framework, suggesting the market may be undervaluing the business on several fronts. Next, we will walk through the different valuation approaches to see what they indicate, before wrapping up with an even more intuitive way to think about what the stock may be worth.
Find out why Whirlpool's -32.8% return over the last year is lagging behind its peers.
Approach 1: Whirlpool Discounted Cash Flow (DCF) Analysis
A Discounted Cash Flow model estimates what a business is worth today by projecting the cash it could generate in the future and then discounting those dollars back to their value in the present.
For Whirlpool, the latest twelve month Free Cash Flow is slightly negative at around $1.0 million, reflecting a tough recent period. Analysts and extrapolated estimates, however, point to a recovery, with Free Cash Flow expected to reach about $821 million in 2035 as margins normalize and operations improve. Simply Wall St uses a 2 Stage Free Cash Flow to Equity model for these projections, combining analyst forecasts for the next few years with a gradually slowing growth profile thereafter.
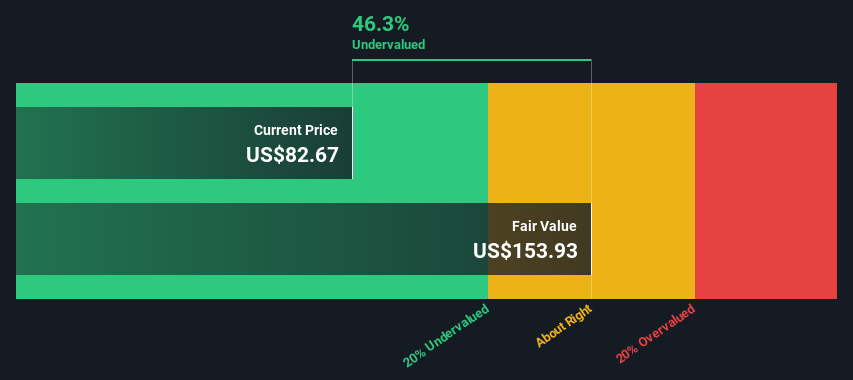
On this basis, the model arrives at an intrinsic value of roughly $108.85 per share. That implies Whirlpool is trading at about a 28.7% discount to its estimated fair value, suggesting the market is still pricing in a lot of pessimism despite improving cash flow expectations.
Result: UNDERVALUED
Our Discounted Cash Flow (DCF) analysis suggests Whirlpool is undervalued by 28.7%. Track this in your watchlist or portfolio, or discover 903 more undervalued stocks based on cash flows.
Approach 2: Whirlpool Price vs Sales
For companies like Whirlpool where earnings can be volatile, the price to sales ratio is often a cleaner way to judge value because revenue tends to be more stable than profit in cyclical businesses.
In general, investors are willing to pay a higher multiple of sales when they expect faster long term growth and see lower risk in margins or the balance sheet. Conversely, slower growth or higher risk usually justifies a lower, or even discounted, price to sales ratio.
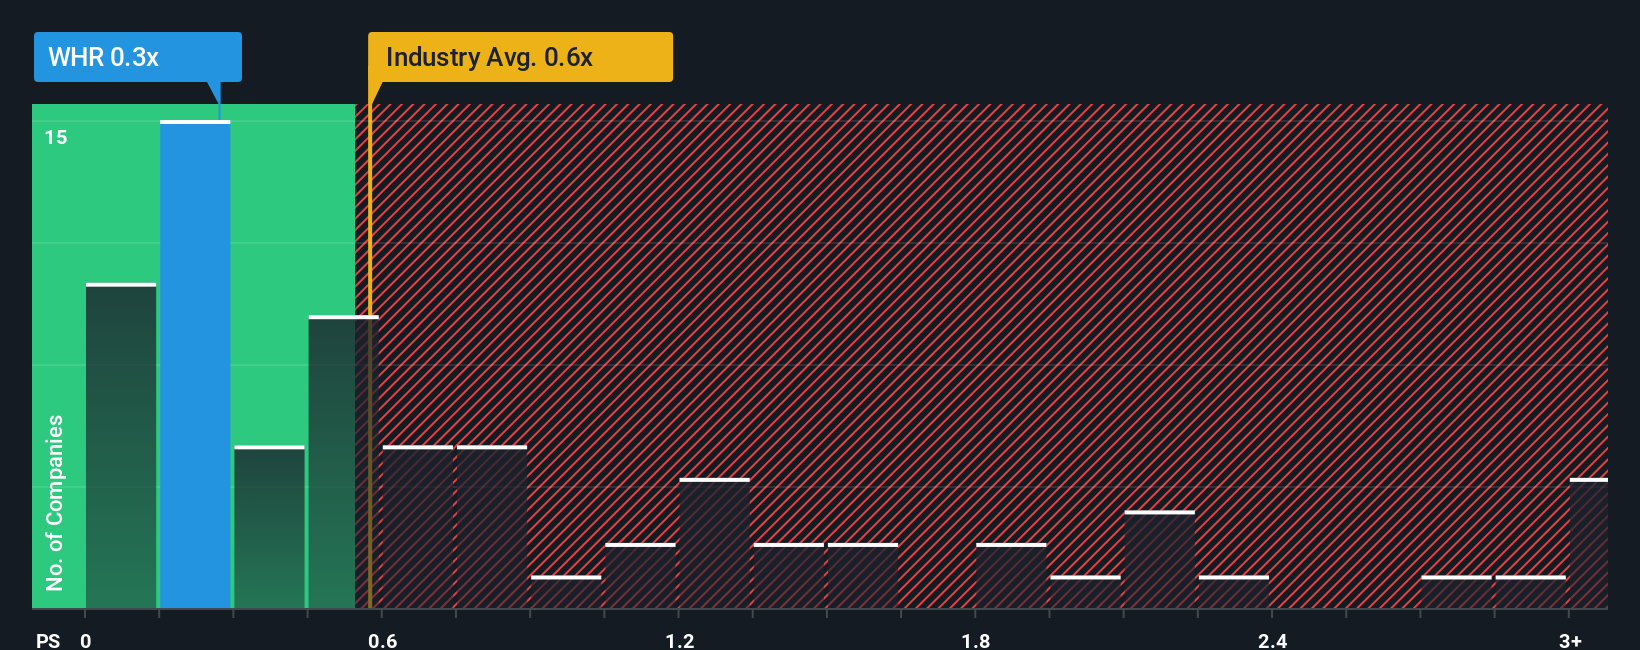
Whirlpool currently trades on a price to sales multiple of about 0.28x, which is well below both the Consumer Durables industry average of roughly 0.64x and the peer group average of around 1.20x. Simply Wall St also calculates a Fair Ratio for Whirlpool of about 0.61x, which represents the price to sales multiple the company might deserve given its growth outlook, profitability, risk profile, industry and size. This Fair Ratio is more informative than a simple peer comparison because it adjusts for Whirlpool specific fundamentals rather than assuming all companies in the sector warrant the same multiple. With the actual multiple at 0.28x versus a Fair Ratio near 0.61x, Whirlpool appears attractively valued on a sales basis.
Result: UNDERVALUED
PS ratios tell one story, but what if the real opportunity lies elsewhere? Discover 1442 companies where insiders are betting big on explosive growth.
Upgrade Your Decision Making: Choose your Whirlpool Narrative
Earlier we mentioned that there is an even better way to understand valuation, so let us introduce you to Narratives, a simple way to pair your view of Whirlpool’s story with the numbers behind it. A Narrative is your own investment storyline that connects what you believe about Whirlpool’s products, competition, and industry to a concrete financial forecast for revenue, earnings and margins, and then to a Fair Value estimate. On Simply Wall St, millions of investors build and share Narratives on the Community page, making it easy to see how different assumptions lead to different valuations and buy or sell decisions by comparing each Narrative Fair Value to the current share price. These Narratives update dynamically as new earnings, news or guidance arrive, so your story, forecast and valuation stay in sync with reality. For Whirlpool, one investor might build a more optimistic Narrative around premium innovation, international growth and margin recovery that points to value closer to $145 per share, while a more cautious investor could focus on mature markets, intense competition and macro risks, landing nearer to $63 per share.
Do you think there's more to the story for Whirlpool? Head over to our Community to see what others are saying!
This article by Simply Wall St is general in nature. We provide commentary based on historical data and analyst forecasts only using an unbiased methodology and our articles are not intended to be financial advice. It does not constitute a recommendation to buy or sell any stock, and does not take account of your objectives, or your financial situation. We aim to bring you long-term focused analysis driven by fundamental data. Note that our analysis may not factor in the latest price-sensitive company announcements or qualitative material. Simply Wall St has no position in any stocks mentioned.
Have feedback on this article? Concerned about the content? Get in touch with us directly. Alternatively, email editorial-team@simplywallst.com