
Investors Will Want CTR MobilityLtd's (KRX:308170) Growth In ROCE To Persist
If we want to find a potential multi-bagger, often there are underlying trends that can provide clues. Firstly, we'd want to identify a growing return on capital employed (ROCE) and then alongside that, an ever-increasing base of capital employed. This shows us that it's a compounding machine, able to continually reinvest its earnings back into the business and generate higher returns. So when we looked at CTR MobilityLtd (KRX:308170) and its trend of ROCE, we really liked what we saw.
Understanding Return On Capital Employed (ROCE)
If you haven't worked with ROCE before, it measures the 'return' (pre-tax profit) a company generates from capital employed in its business. The formula for this calculation on CTR MobilityLtd is:
Return on Capital Employed = Earnings Before Interest and Tax (EBIT) ÷ (Total Assets - Current Liabilities)
0.042 = ₩5.7b ÷ (₩310b - ₩175b) (Based on the trailing twelve months to September 2025).
So, CTR MobilityLtd has an ROCE of 4.2%. In absolute terms, that's a low return and it also under-performs the Auto Components industry average of 7.3%.
See our latest analysis for CTR MobilityLtd
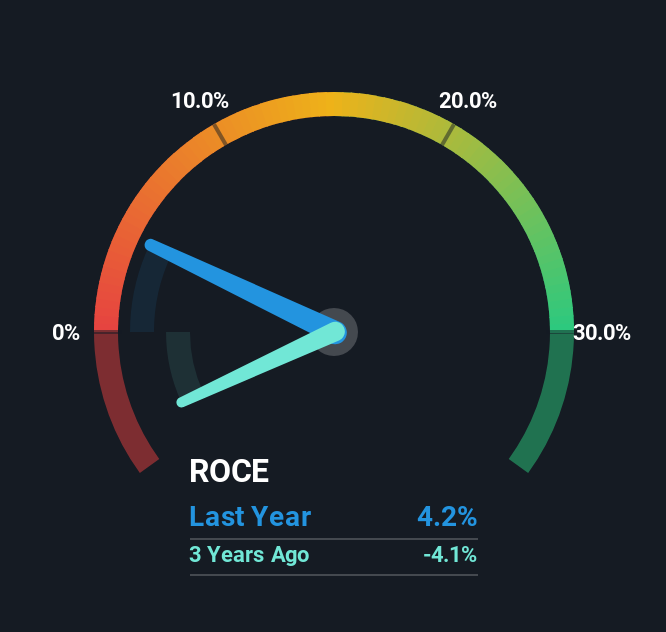
Historical performance is a great place to start when researching a stock so above you can see the gauge for CTR MobilityLtd's ROCE against it's prior returns. If you want to delve into the historical earnings , check out these free graphs detailing revenue and cash flow performance of CTR MobilityLtd.
How Are Returns Trending?
Even though ROCE is still low in absolute terms, it's good to see it's heading in the right direction. Looking at the data, we can see that even though capital employed in the business has remained relatively flat, the ROCE generated has risen by 22% over the last five years. Basically the business is generating higher returns from the same amount of capital and that is proof that there are improvements in the company's efficiencies. On that front, things are looking good so it's worth exploring what management has said about growth plans going forward.
On a side note, we noticed that the improvement in ROCE appears to be partly fueled by an increase in current liabilities. Effectively this means that suppliers or short-term creditors are now funding 57% of the business, which is more than it was five years ago. And with current liabilities at those levels, that's pretty high.
Our Take On CTR MobilityLtd's ROCE
To bring it all together, CTR MobilityLtd has done well to increase the returns it's generating from its capital employed. However the stock is down a substantial 85% in the last five years so there could be other areas of the business hurting its prospects. Still, it's worth doing some further research to see if the trends will continue into the future.
One final note, you should learn about the 2 warning signs we've spotted with CTR MobilityLtd (including 1 which can't be ignored) .
While CTR MobilityLtd isn't earning the highest return, check out this free list of companies that are earning high returns on equity with solid balance sheets.
Have feedback on this article? Concerned about the content? Get in touch with us directly. Alternatively, email editorial-team (at) simplywallst.com.
This article by Simply Wall St is general in nature. We provide commentary based on historical data and analyst forecasts only using an unbiased methodology and our articles are not intended to be financial advice. It does not constitute a recommendation to buy or sell any stock, and does not take account of your objectives, or your financial situation. We aim to bring you long-term focused analysis driven by fundamental data. Note that our analysis may not factor in the latest price-sensitive company announcements or qualitative material. Simply Wall St has no position in any stocks mentioned.