
Access (TSE:4813) Losses Deepen, Challenging Bullish Discount-Valuation Narrative
Access (TSE:4813) has just posted its Q3 2026 scorecard, with the latest trailing twelve month numbers showing revenue of about ¥19.1 billion and a basic EPS of roughly -¥174.4, underlining that the business is still running at a loss despite meaningful scale. Looking back over recent quarters, the company has seen revenue move from ¥2,423.9 million in Q3 2025 to ¥3,836.9 million in Q2 2026 while quarterly basic EPS shifted from -¥30.5 to -¥38.5, putting the spotlight firmly on how quickly management can improve profitability from here.
See our full analysis for Access.With the latest figures on the table, the next step is to see how these margins and losses line up with the prevailing narratives around Access, and where the hard numbers start to challenge those storylines.
Curious how numbers become stories that shape markets? Explore Community Narratives
Losses Deepen To ¥6.6 Billion Over Last Year
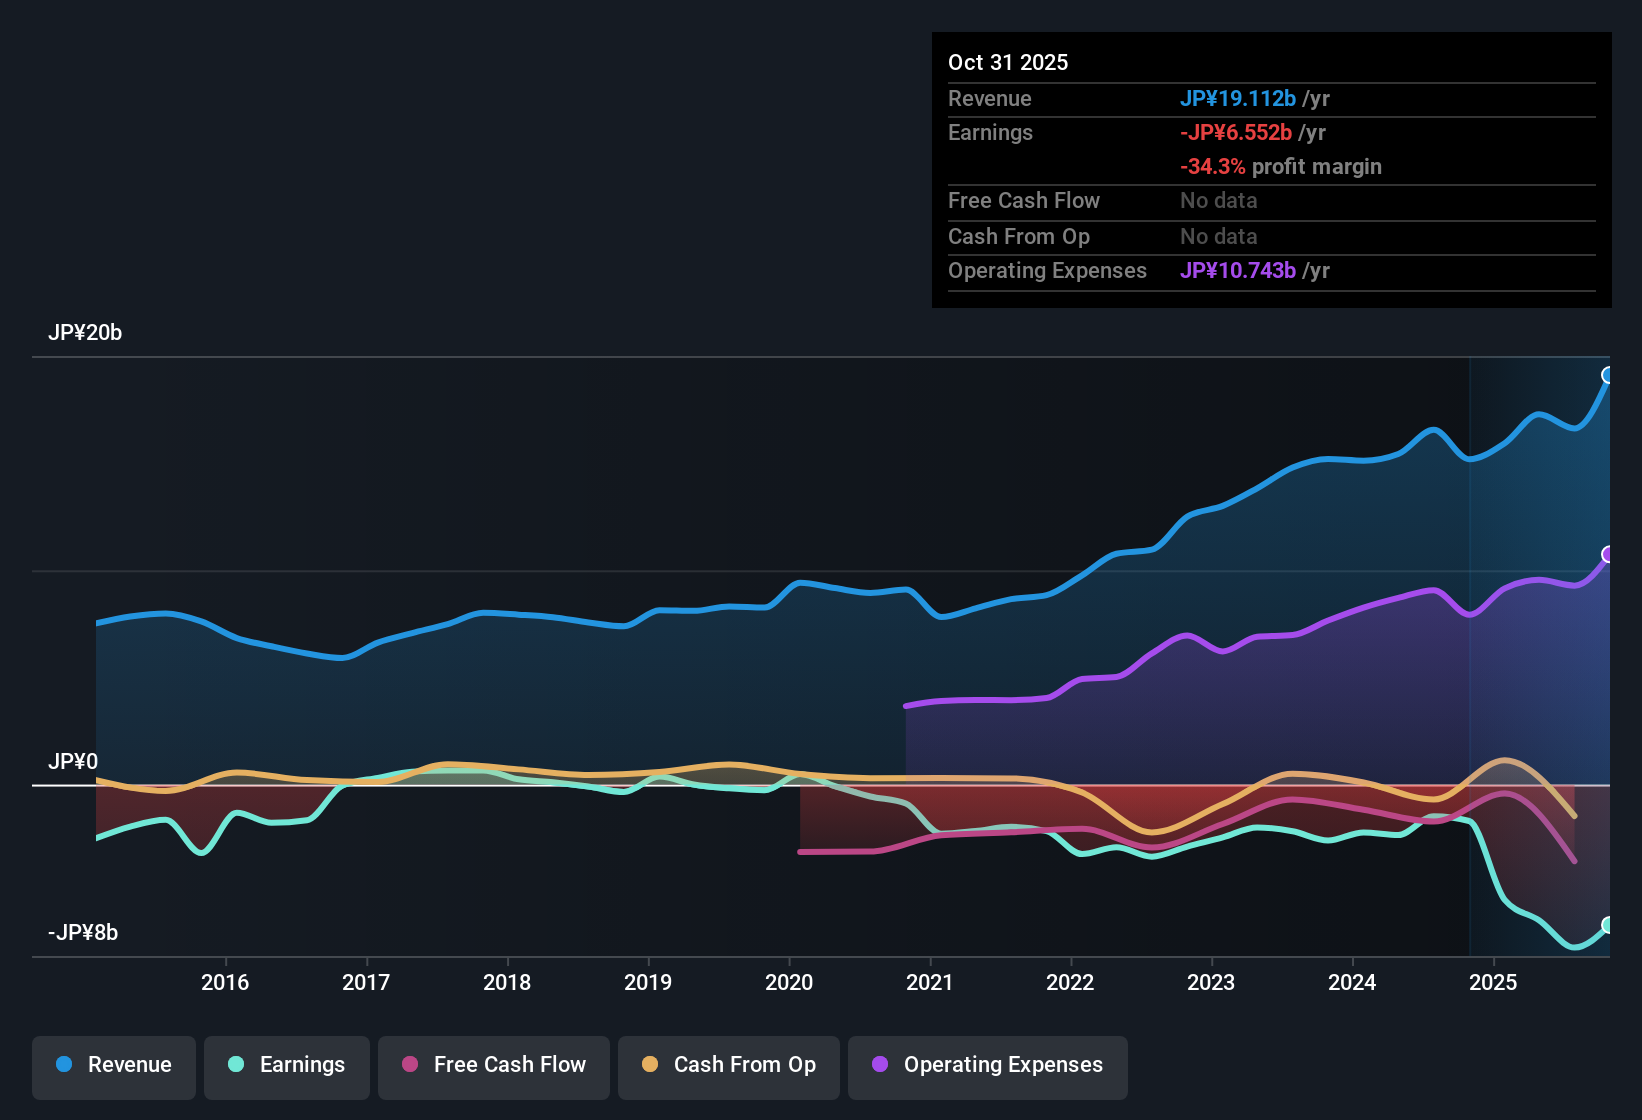
- Over the latest twelve months, Access booked about ¥19.1 billion in revenue but still recorded roughly ¥6.6 billion in net losses, showing that scale has not yet translated into profitability.
- Bears argue that profitability is deteriorating, and the figures back that up, with net income moving from about -¥1.5 billion in Q2 2025 to around -¥6.6 billion over the latest twelve months and a five year trend of losses worsening about 24.2% per year.
- That longer term decline sits alongside trailing twelve month basic EPS of roughly -¥174 per share, compared with about -¥39 per share back in the trailing window ending Q2 2025, pointing to a much heavier earnings drag today.
- Even in the shorter term, net income excluding extra items was around -¥1.1 billion in Q3 2025 and about -¥1.4 billion in Q2 2026, which supports the view that the business has not yet stabilized its losses.
Top Line Near ¥19.1 Billion But Growth Not Backed By Forecasts
- On a trailing basis, revenue has climbed from about ¥15.2 billion in the period ending Q3 2025 to roughly ¥19.1 billion now, so the company is selling more even though it remains in the red.
- Bullish investors might focus on that revenue expansion and Access role across IoT, connected cars, and network software, but the data provided does not include any forecasts pointing to revenue or earnings growing faster than the broader Japanese market.
- The trailing twelve month revenue path, from roughly ¥15.2 billion to ¥19.1 billion, shows that customers are still spending on Access offerings, yet this has not translated into visible margin improvement in the reported numbers.
- Without forward estimates in the dataset, the tension for a bullish case is that recent growth in yen terms has come alongside deeper losses rather than a move toward breakeven.
1x Price To Sales Versus 2x For Peers
- The shares trade around 1x trailing sales compared with roughly 2x for Japanese software peers, so investors are paying a lower multiple for each yen of Access revenue at the current share price of ¥510.
- Some investors see this discount multiple as potential upside, but the figures highlight why the market might be cautious, since losses have deepened from about -¥1.5 billion in the trailing window ending Q2 2025 to roughly -¥6.6 billion now even as the valuation sits below industry averages.
- That combination of a 1x price to sales ratio and a five year pattern of earnings declining around 24.2% per year suggests the lower multiple is being set against a track record of worsening profitability.
- If profitability improved, the gap versus the roughly 2x industry and peer average could look attractive, but so far the trailing EPS path, from about -¥39 to roughly -¥174, has not yet justified a higher market multiple.
Next Steps
Don't just look at this quarter; the real story is in the long-term trend. We've done an in-depth analysis on Access's growth and its valuation to see if today's price is a bargain. Add the company to your watchlist or portfolio now so you don't miss the next big move.
See What Else Is Out There
Access is growing revenue but continues to post deepening losses, with worsening earnings trends suggesting profitability and financial resilience remain a major concern for shareholders.
If these mounting losses make you uneasy, use our solid balance sheet and fundamentals stocks screener (1943 results) to quickly shift your focus toward financially stronger businesses built to withstand pressure and compound more predictably.
This article by Simply Wall St is general in nature. We provide commentary based on historical data and analyst forecasts only using an unbiased methodology and our articles are not intended to be financial advice. It does not constitute a recommendation to buy or sell any stock, and does not take account of your objectives, or your financial situation. We aim to bring you long-term focused analysis driven by fundamental data. Note that our analysis may not factor in the latest price-sensitive company announcements or qualitative material. Simply Wall St has no position in any stocks mentioned.
Have feedback on this article? Concerned about the content? Get in touch with us directly. Alternatively, email editorial-team@simplywallst.com