
Has Nova’s 345% Five Year Surge Stretched Its Valuation Too Far in 2025?
- If you are wondering whether Nova is still a smart buy after such a big run, you are not alone. This article is going to dig straight into what the current price really implies about its value.
- The stock has cooled slightly in the last week, down 2.7%. That comes after a 6.4% gain over 30 days and a 55.7% year-to-date climb, with 67.7% over 1 year and 345.6% over 5 years, which indicates investors have been steadily bidding up its future prospects.
- Recent attention on the semiconductor equipment space, including ongoing demand for advanced process control tools and market chatter about capacity expansions at major chipmakers, has helped keep Nova on many investors' watchlists. At the same time, broader debates about how long the current chip investment cycle can last have added some volatility, as the market tries to balance long term structural demand with the risk of shorter term slowdowns.
- Despite the strong share price performance, Nova only scores 1/6 on our valuation checks. This suggests the market might be pricing in a lot of optimism and makes it worth unpacking how different valuation methods look at this stock, before we finish up with a more nuanced way to think about what Nova is really worth.
Nova scores just 1/6 on our valuation checks. See what other red flags we found in the full valuation breakdown.
Approach 1: Nova Discounted Cash Flow (DCF) Analysis
A Discounted Cash Flow, or DCF, model estimates what a company is worth by projecting the cash it is expected to generate in the future and then discounting those cash flows back to today using a required rate of return.
For Nova, the latest twelve month Free Cash Flow is about $229 million. Analysts and internal projections expect this to rise steadily, with Simply Wall St using a 2 Stage Free Cash Flow to Equity model that extends estimates out over the next decade. By 2035, projected annual Free Cash Flow is roughly $348 million, reflecting modest but consistent growth from the current base.
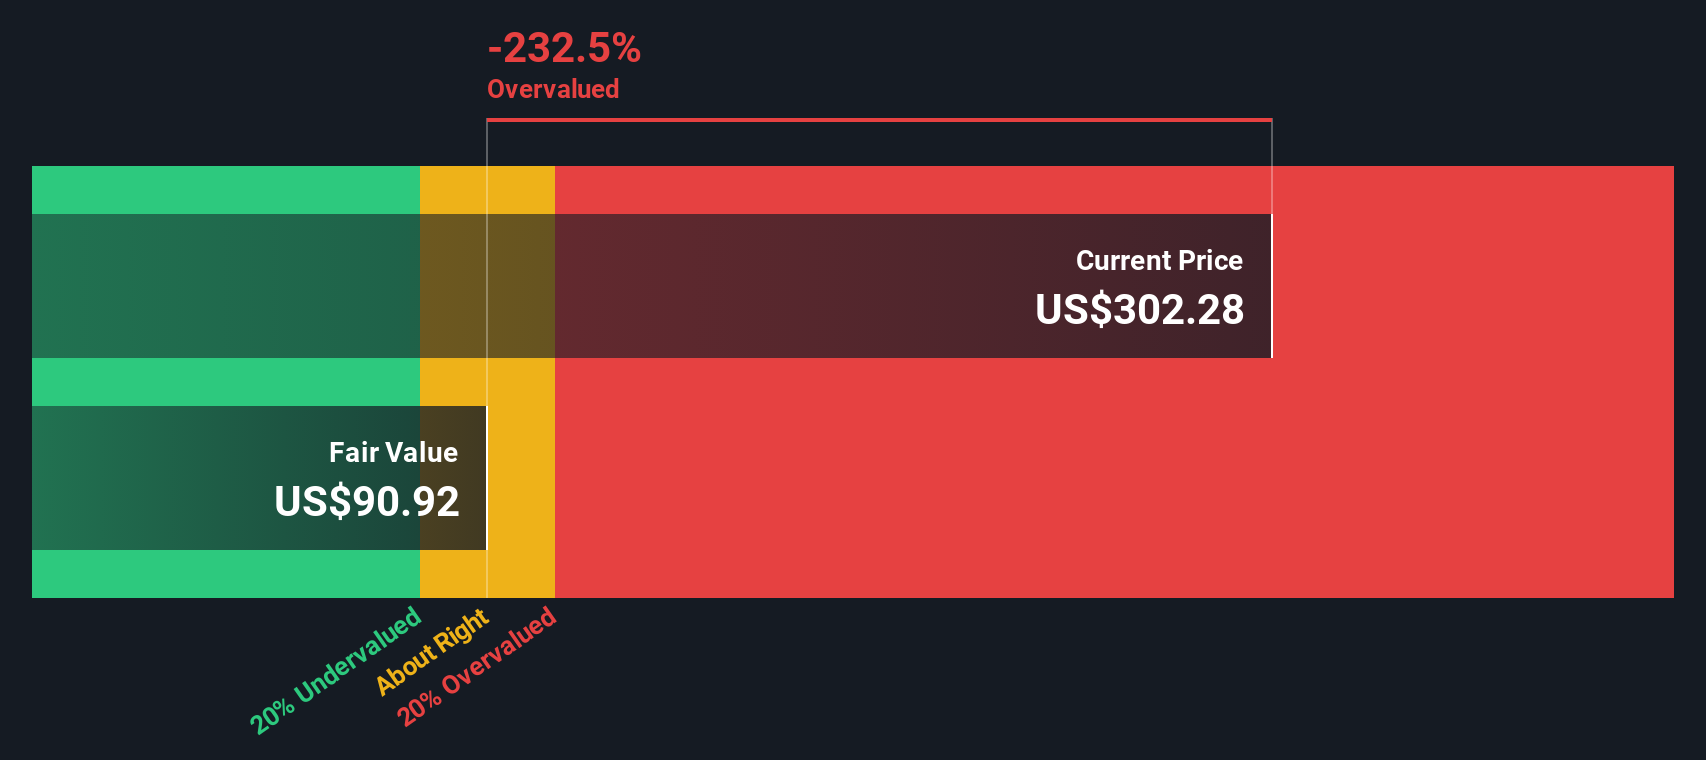
When all of these future cash flows are discounted back to today and combined with a terminal value, the model arrives at an intrinsic value of about $83.01 per share. Compared with the current share price, this implies the stock is roughly 280.5% overvalued. This suggests that the market is baking in a far more optimistic cash flow path than the model assumes.
Result: OVERVALUED
Our Discounted Cash Flow (DCF) analysis suggests Nova may be overvalued by 280.5%. Discover 908 undervalued stocks or create your own screener to find better value opportunities.
Approach 2: Nova Price vs Earnings
For a profitable business like Nova, the price to earnings, or PE, ratio is a useful yardstick because it directly links what investors pay today to the profits the company is generating right now. In general, faster growing and less risky companies can justify a higher PE ratio, while slower growth or higher risk usually calls for a lower, more conservative multiple.
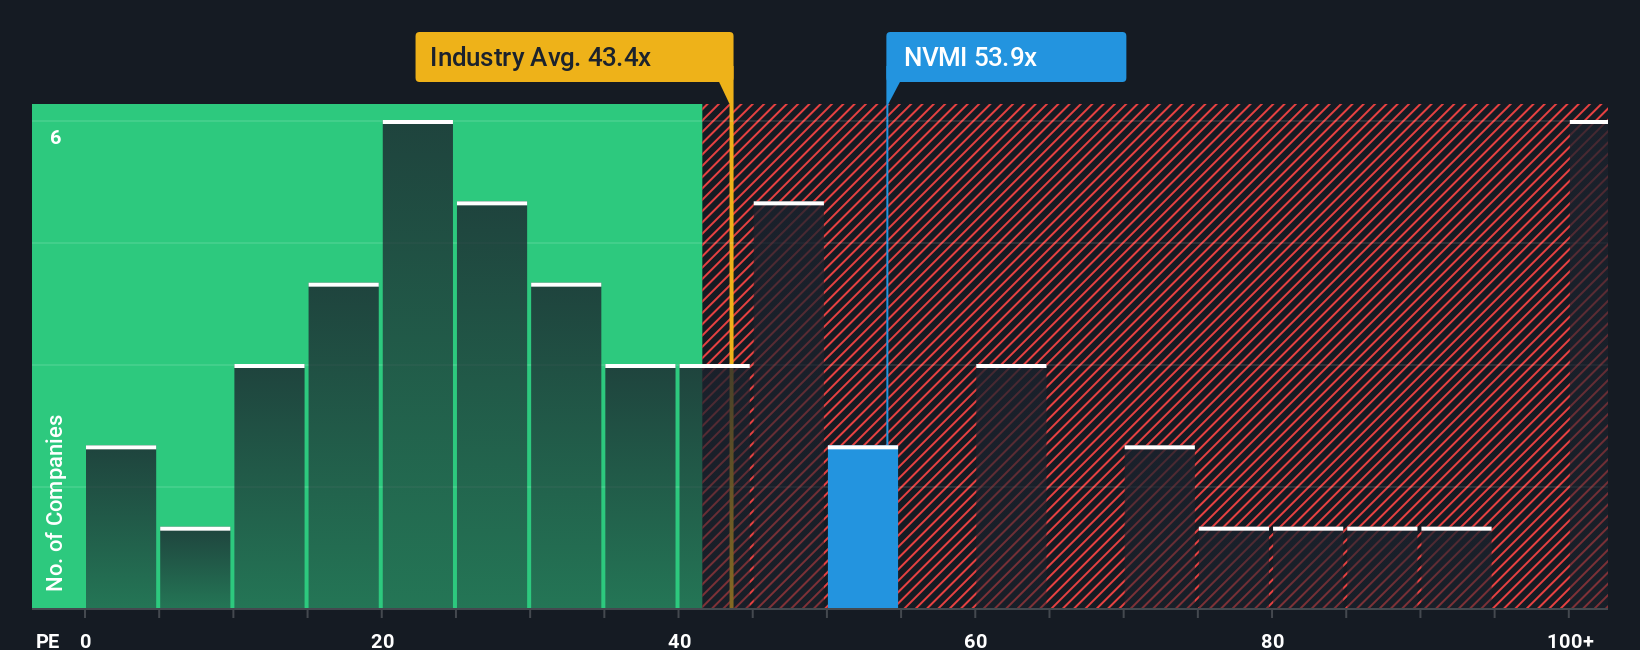
Nova currently trades on a PE of about 38.2x. That is slightly above the broader Semiconductor industry average of around 37.0x, but sits below the 56.1x average of closer peers, which are priced for much stronger growth. Simply Wall St also calculates a proprietary Fair Ratio of 27.0x for Nova, which is the PE level the company might reasonably deserve once factors like its earnings growth outlook, profitability, risk profile, industry position and market cap are all taken into account.
This Fair Ratio is more informative than a simple peer or industry comparison because it adjusts for Nova’s specific strengths and vulnerabilities rather than assuming all semiconductor stocks should trade at similar levels. Set against the current 38.2x PE, the 27.0x Fair Ratio suggests Nova’s shares are trading well above what its fundamentals alone would support.
Result: OVERVALUED
PE ratios tell one story, but what if the real opportunity lies elsewhere? Discover 1444 companies where insiders are betting big on explosive growth.
Upgrade Your Decision Making: Choose your Nova Narrative
Earlier we mentioned that there is an even better way to understand valuation, so let us introduce you to Narratives. These are simply the stories investors tell about a company’s future that sit behind the numbers like fair value, revenue, earnings and margins. Narratives link that story to a financial forecast and then to a fair value estimate. On Simply Wall St’s Community page, used by millions of investors, Narratives are an easy, accessible tool that help you consider whether to buy or sell by comparing each Narrative’s Fair Value to the current Price. They update dynamically whenever new information, such as news or earnings, comes in. For Nova, one Narrative might lean into stronger DRAM fab spending, AI demand and expanding high margin services to illustrate a Fair Value around $365 per share. A more cautious Narrative might focus on customer concentration, geopolitical risks and execution challenges to support a far lower fair value. Seeing these side by side makes it clearer where your own view fits and what the gap between price and value really is.
Do you think there's more to the story for Nova? Head over to our Community to see what others are saying!

This article by Simply Wall St is general in nature. We provide commentary based on historical data and analyst forecasts only using an unbiased methodology and our articles are not intended to be financial advice. It does not constitute a recommendation to buy or sell any stock, and does not take account of your objectives, or your financial situation. We aim to bring you long-term focused analysis driven by fundamental data. Note that our analysis may not factor in the latest price-sensitive company announcements or qualitative material. Simply Wall St has no position in any stocks mentioned.
Have feedback on this article? Concerned about the content? Get in touch with us directly. Alternatively, email editorial-team@simplywallst.com