
Assessing Almonty Industries (TSX:AII) Valuation After Equity Raise and Withdrawal of $500m Shelf Registration
Almonty Industries (TSX:AII) just pulled a $500 million universal shelf registration after raising $112.5 million in a follow on equity deal, a move that clearly reshapes its near term funding playbook.
See our latest analysis for Almonty Industries.
That pivot comes after a powerful run, with the share price at $9.32 delivering a year to date share price return of over 500 percent and a roughly six fold one year total shareholder return. This comes even though the 7 day share price pullback suggests momentum is cooling as the market digests the follow on equity deal and recent leadership changes.
If this kind of funding driven story has caught your eye, it could be worth scanning fast growing stocks with high insider ownership for other fast moving names with strong insider alignment.
With the stock now trading close to analyst targets, yet still at a steep discount to some intrinsic value estimates, investors face a key question: is there real upside left here, or has the market already priced in future growth?
Price to Book of 13.2x: Is it justified?
Almonty Industries last closed at CA$9.32, and on a price to book basis the stock screens as expensive versus both peers and the wider Canadian metals and mining space.
The price to book ratio compares a company’s market value to its accounting net assets, a common yardstick for asset heavy miners where book value reflects owned projects and infrastructure. When that multiple pushes well above sector norms, it often signals that investors are paying up for future growth, operational turnaround, or the strategic scarcity of the underlying resource.
In Almonty’s case, the current 13.2x price to book multiple sits sharply above the Canadian metals and mining industry average of 2.8x and even above the peer group’s already elevated 11.1x. That kind of premium suggests the market is aggressively capitalising expected revenue growth and a move to high future returns on equity, rather than current profitability.
See what the numbers say about this price — find out in our valuation breakdown.
Result: Price to Book of 13.2x (OVERVALUED)
However, investors still face risks, including execution challenges at its international tungsten projects and the possibility that lofty growth expectations may prove too optimistic.
Find out about the key risks to this Almonty Industries narrative.
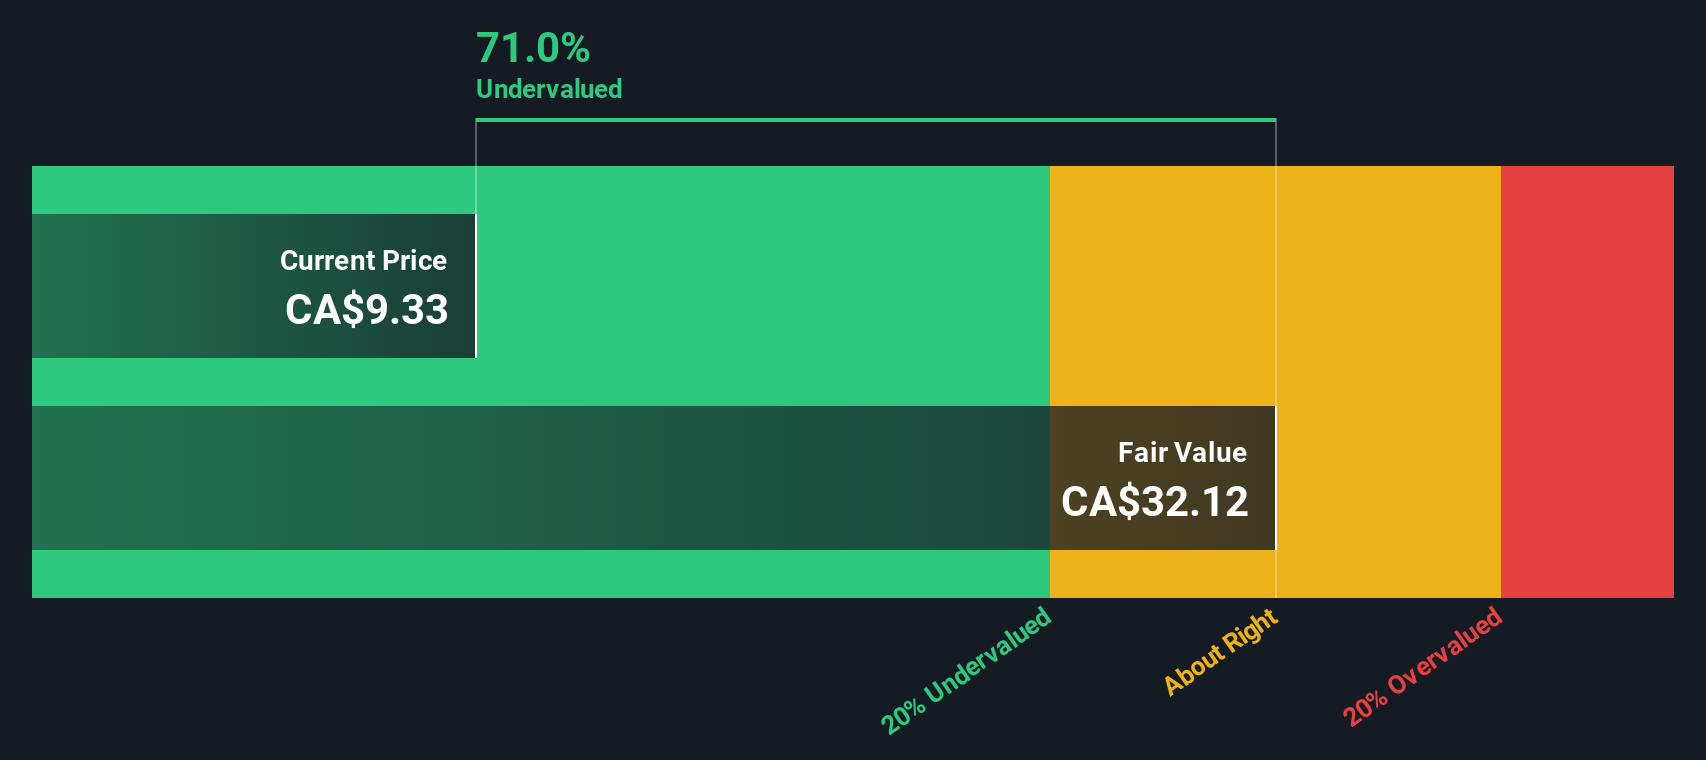
Another View: DCF Signals Deep Discount
While the price to book ratio appears expensive, our DCF model suggests a different perspective. It estimates fair value at around CA$35.95 per share, which implies that Almonty trades roughly 74 percent below that level. Is the market paying a premium for assets yet underestimating future cash flows?
Look into how the SWS DCF model arrives at its fair value.
Simply Wall St performs a discounted cash flow (DCF) on every stock in the world every day (check out Almonty Industries for example). We show the entire calculation in full. You can track the result in your watchlist or portfolio and be alerted when this changes, or use our stock screener to discover 909 undervalued stocks based on their cash flows. If you save a screener we even alert you when new companies match - so you never miss a potential opportunity.
Build Your Own Almonty Industries Narrative
If you see the story differently or prefer to dig into the numbers yourself, you can shape a custom view in just minutes: Do it your way.
A great starting point for your Almonty Industries research is our analysis highlighting 2 key rewards and 1 important warning sign that could impact your investment decision.
Ready for more high conviction ideas?
Do not stop your research with one company. Use the Simply Wall Street Screener to uncover fresh opportunities that match your strategy before others react.
- Capture early stage growth potential by targeting these 3612 penny stocks with strong financials that already show robust fundamentals and room to scale.
- Position yourself for the next wave of innovation by focusing on these 26 AI penny stocks poised to benefit from accelerating adoption of intelligent automation.
- Lock in income and stability by zeroing in on these 13 dividend stocks with yields > 3% that can strengthen your portfolio’s cash flow and resilience.
This article by Simply Wall St is general in nature. We provide commentary based on historical data and analyst forecasts only using an unbiased methodology and our articles are not intended to be financial advice. It does not constitute a recommendation to buy or sell any stock, and does not take account of your objectives, or your financial situation. We aim to bring you long-term focused analysis driven by fundamental data. Note that our analysis may not factor in the latest price-sensitive company announcements or qualitative material. Simply Wall St has no position in any stocks mentioned.
Have feedback on this article? Concerned about the content? Get in touch with us directly. Alternatively, email editorial-team@simplywallst.com