
Is It Too Late To Consider Dollar General After 2025 Rebound And Cash Flow Outlook?
- If you are wondering whether Dollar General is still a bargain after its big rebound, or if the easy money has already been made, this breakdown will help you decide whether the current price really stacks up against its fundamentals.
- The stock has bounced sharply, up 7.0% over the last week, 27.4% over the past month, and a striking 75.8% year to date. It is still nursing 3 year and 5 year losses of 41.8% and 32.0% respectively, which makes the recent momentum especially interesting.
- Investors have been reacting to a mix of strategic updates and operational adjustments, including management’s renewed focus on store standards and inventory discipline that aims to rebuild shopper trust in core rural and value conscious markets. There has also been growing commentary around how discounters like Dollar General could benefit if consumers keep trading down, which is helping reset expectations after a difficult multi year stretch.
- On our framework, Dollar General currently scores a 2/6 valuation check rating, suggesting it screens as undervalued on a couple of metrics but far from universally cheap. Next, we will walk through the main valuation approaches we use and then finish with a more nuanced way to think about what the market is really pricing in.
Dollar General scores just 2/6 on our valuation checks. See what other red flags we found in the full valuation breakdown.
Approach 1: Dollar General Discounted Cash Flow (DCF) Analysis
A Discounted Cash Flow model projects a company’s future cash flows and then discounts them back to today to estimate what the business is worth right now. For Dollar General, this approach looks at the cash the company can return to shareholders over time and adjusts it for risk and the time value of money.
Dollar General generated about $2.06 billion in Free Cash Flow over the last twelve months, providing a solid starting base. Analysts forecast FCF to ease to around $1.88 billion by 2030, with a detailed 2 Stage Free Cash Flow to Equity model used to bridge the years in between. Beyond the initial analyst horizon, Simply Wall St extrapolates growth at moderating rates to reflect a mature but still expanding retailer.
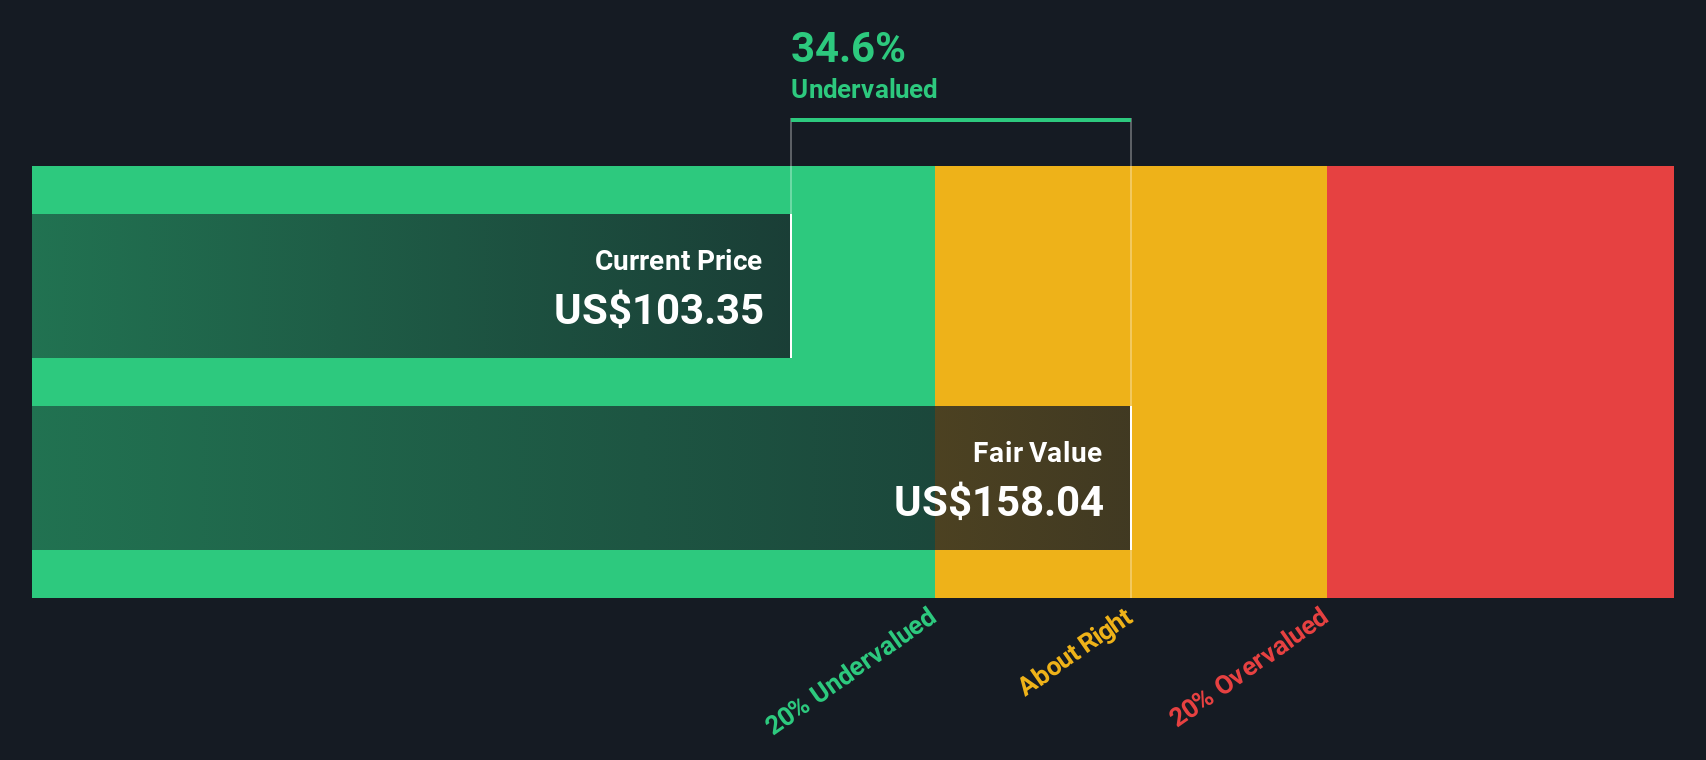
Aggregating and discounting these projected cash flows yields an intrinsic value estimate of roughly $172.70 per share. With the DCF implying the shares are about 23.0% below this fair value estimate, the model currently points to Dollar General trading at a noticeable discount.
Result: UNDERVALUED
Our Discounted Cash Flow (DCF) analysis suggests Dollar General is undervalued by 23.0%. Track this in your watchlist or portfolio, or discover 906 more undervalued stocks based on cash flows.
Approach 2: Dollar General Price vs Earnings
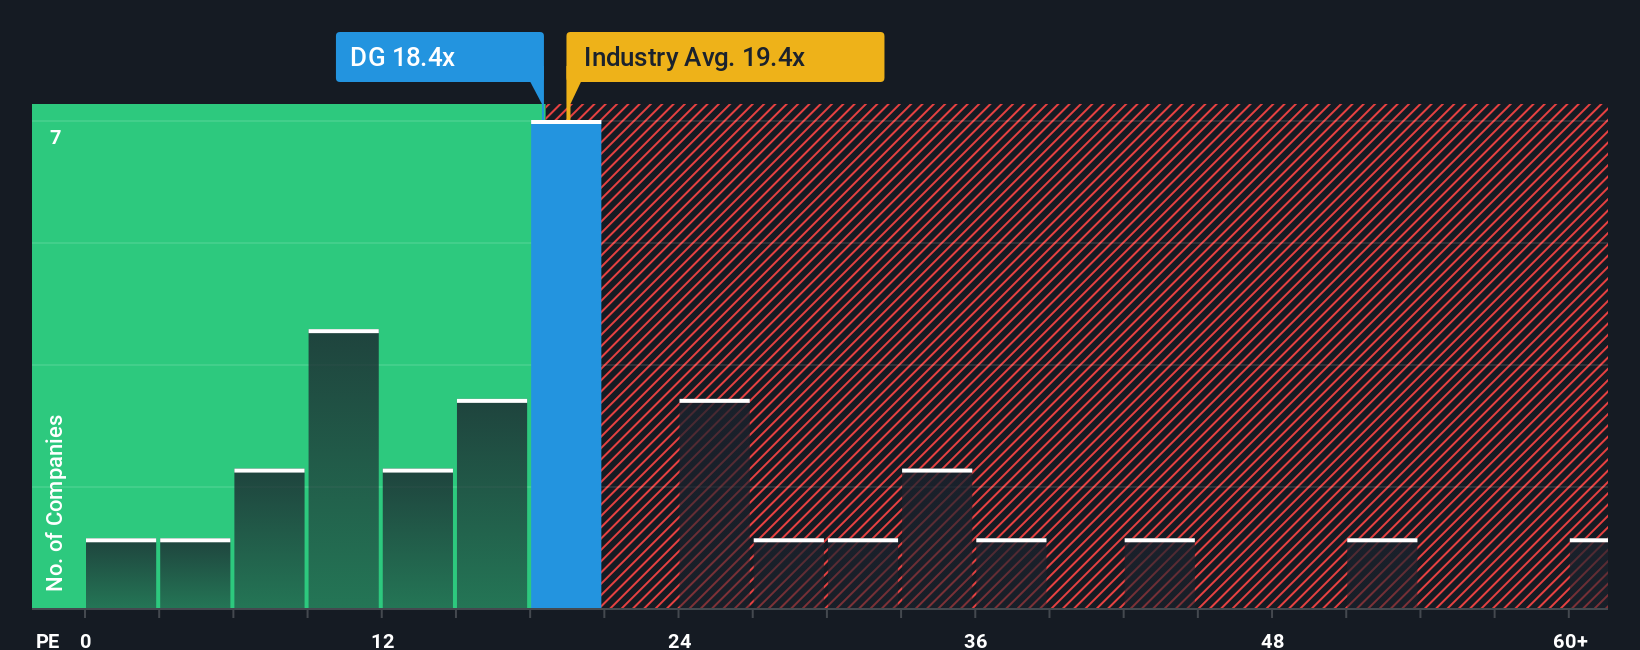
For a mature, profitable retailer like Dollar General, the price to earnings ratio is a natural way to gauge value because it ties the share price directly to the company’s current earning power. Investors are typically willing to pay a higher PE for companies with stronger, more durable growth and lower perceived risk, while slower growth or higher uncertainty usually justifies a lower, more conservative multiple.
Dollar General currently trades on a PE of about 22.9x, which is slightly above the Consumer Retailing industry average of roughly 22.9x and higher than the peer group average of around 20.7x. To put this in better context, Simply Wall St calculates a proprietary Fair Ratio of 21.7x for Dollar General, which reflects its earnings growth outlook, profitability, risk profile, industry positioning and size. This Fair Ratio is more tailored than a simple peer or industry comparison because it adjusts for the specific characteristics that should influence what investors reasonably pay for each dollar of earnings.
Comparing the Fair Ratio of 21.7x with the current PE of 22.9x suggests the shares are trading at a modest premium to what these fundamentals justify.
Result: OVERVALUED
PE ratios tell one story, but what if the real opportunity lies elsewhere? Discover 1449 companies where insiders are betting big on explosive growth.
Upgrade Your Decision Making: Choose your Dollar General Narrative
Earlier we mentioned that there is an even better way to understand valuation. Let us introduce you to Narratives, a simple framework on Simply Wall St’s Community page that lets you write the story behind your numbers. It links your view of a company’s future revenue, earnings, and margins to a financial forecast, a fair value estimate, and ultimately a buy or sell decision based on how that Fair Value compares to today’s Price. The whole picture updates dynamically as new news or earnings arrive. For example, one Dollar General investor might build a more optimistic Narrative around continued store expansion, rising margins and a Fair Value closer to the top end of recent targets. Another might focus on competition, rural saturation and labor costs to justify a more cautious Fair Value nearer the low end. Both use the same easy tools but different stories to decide whether they think the current price offers enough upside or not.
Do you think there's more to the story for Dollar General? Head over to our Community to see what others are saying!

This article by Simply Wall St is general in nature. We provide commentary based on historical data and analyst forecasts only using an unbiased methodology and our articles are not intended to be financial advice. It does not constitute a recommendation to buy or sell any stock, and does not take account of your objectives, or your financial situation. We aim to bring you long-term focused analysis driven by fundamental data. Note that our analysis may not factor in the latest price-sensitive company announcements or qualitative material. Simply Wall St has no position in any stocks mentioned.
Have feedback on this article? Concerned about the content? Get in touch with us directly. Alternatively, email editorial-team@simplywallst.com